Executive Summary
This comprehensive guide delivers detailed technical knowledge, market data, and practical guidance for professionals involved in asphalt pavement planning, design, construction, or maintenance. Updated with 2026 market conditions and latest engineering standards, this resource spans the entire spectrum from basic calculations to advanced engineering practices employed by state DOTs and major contractors across America.
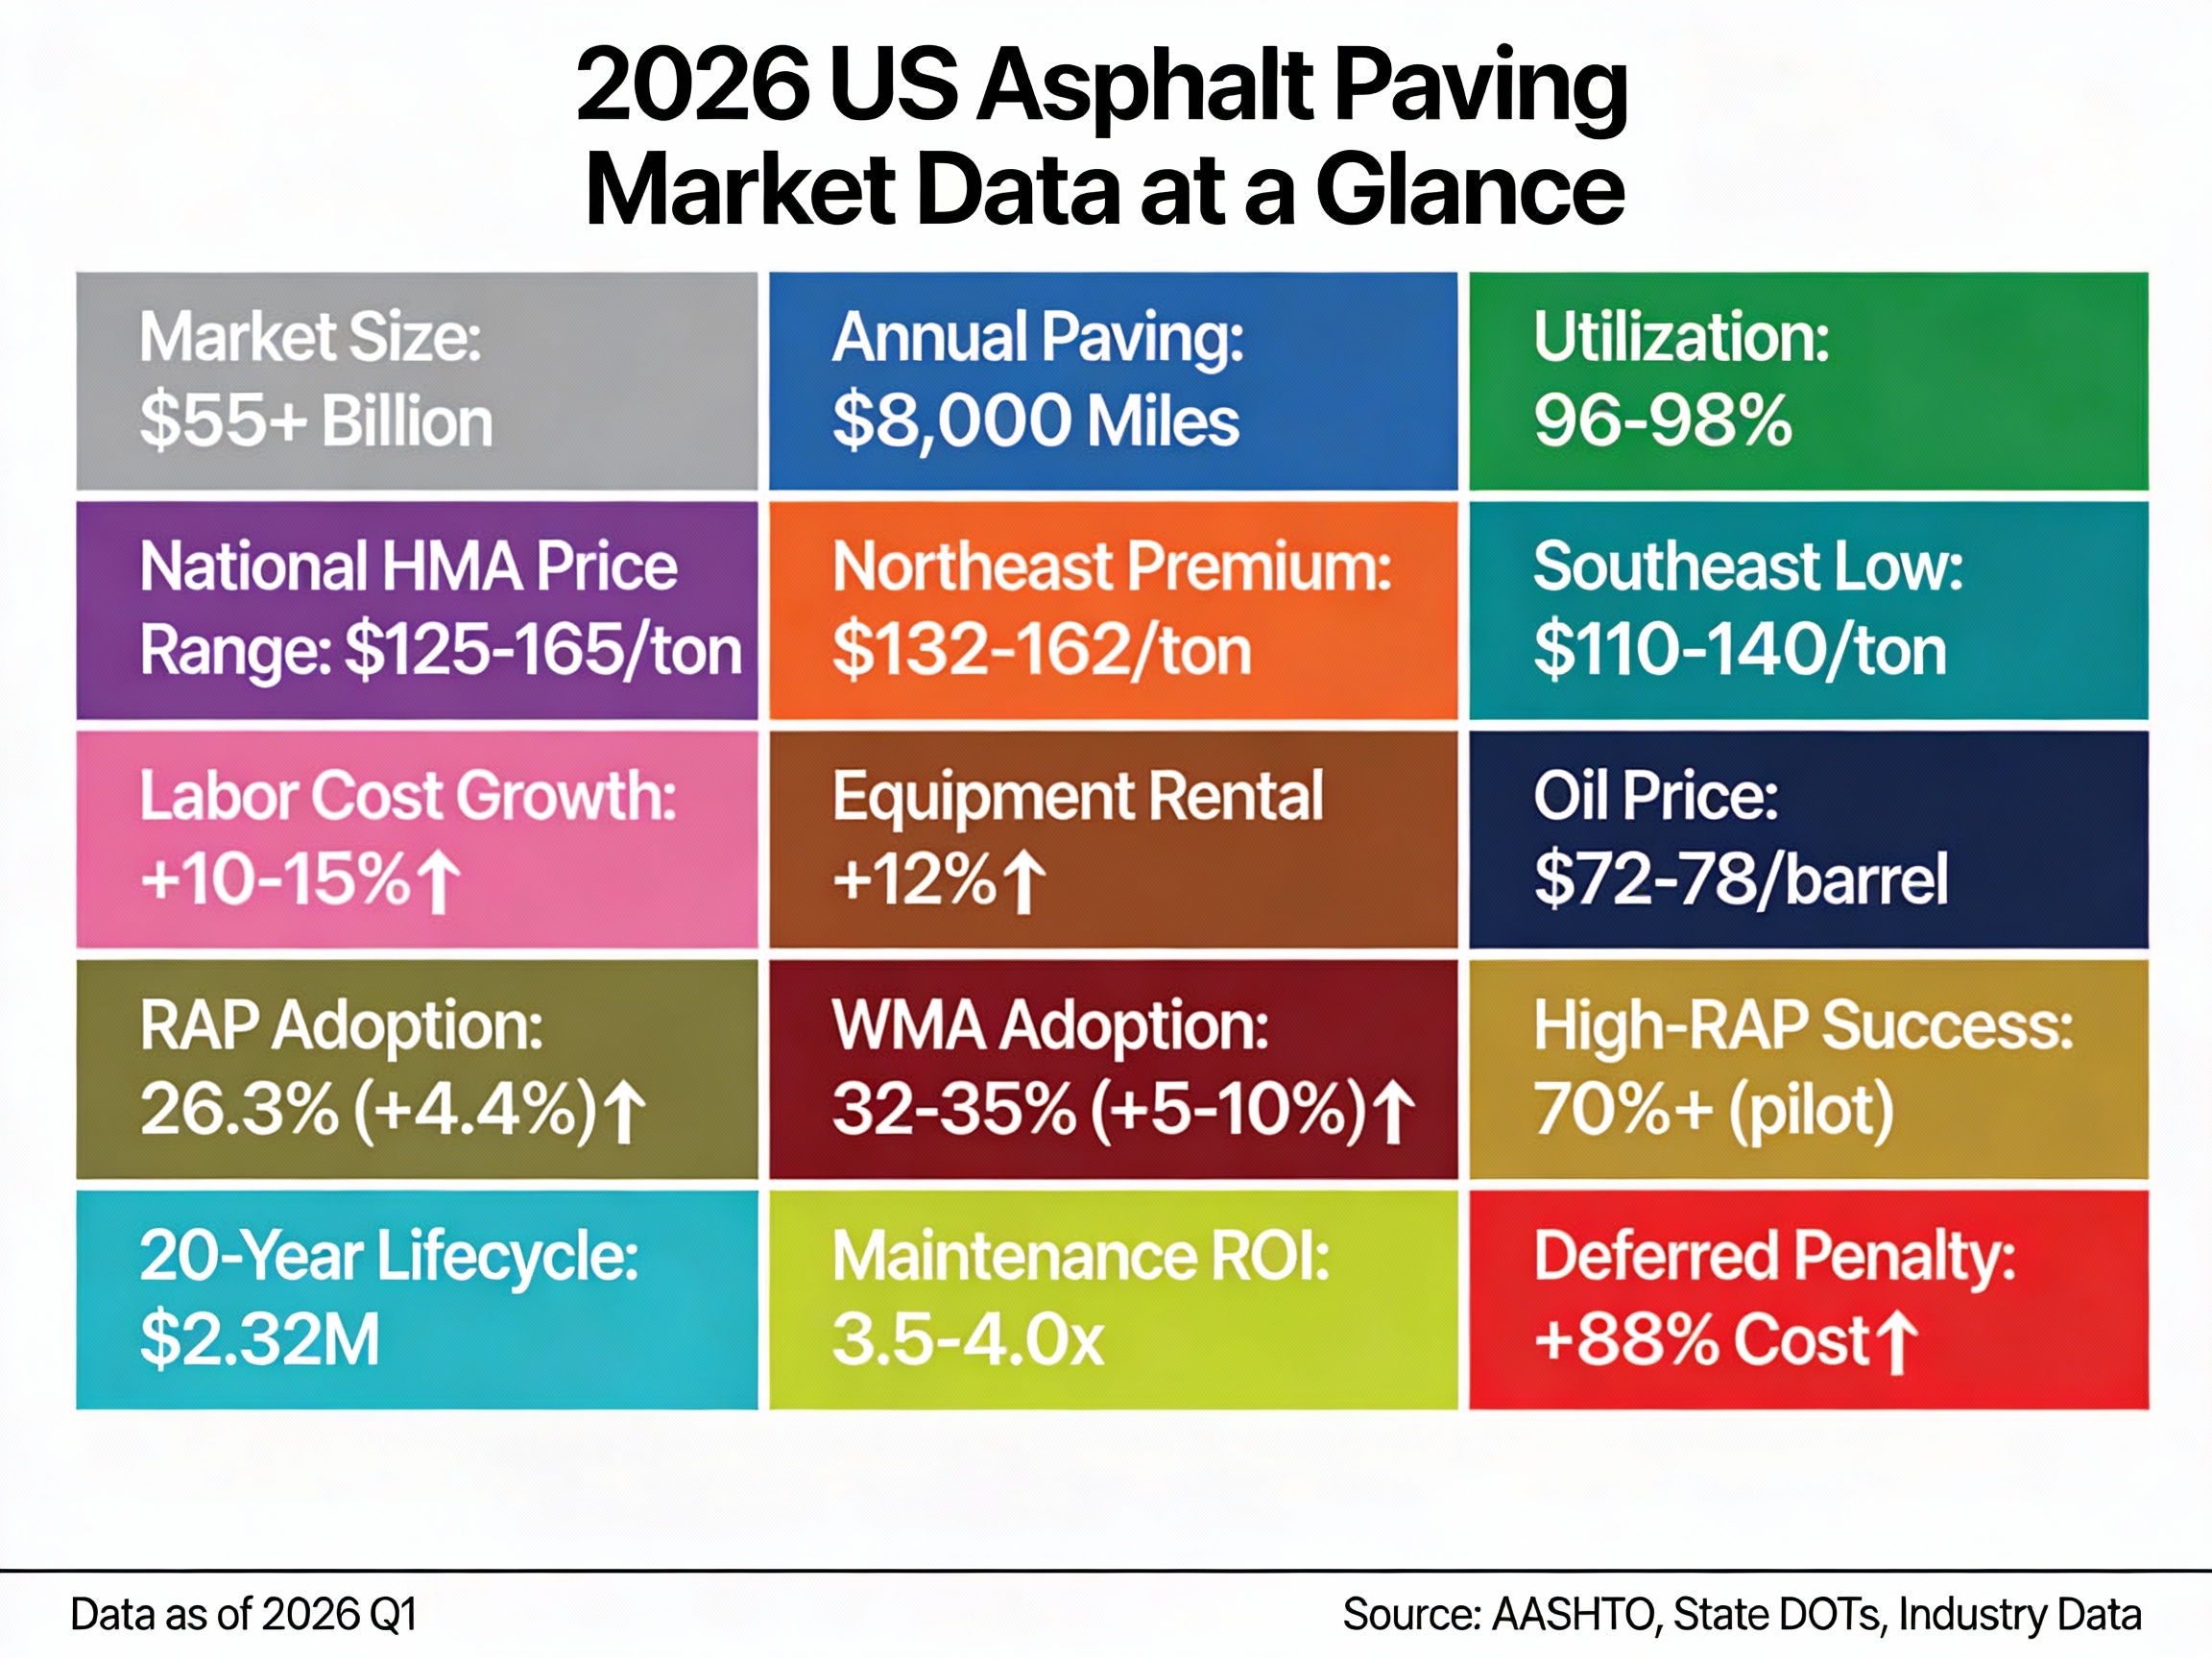
2026 Key Statistics:
- National HMA average price: $125-165 per ton (+12-15% from 2025)
- Average RAP content nationally: 26.3% (cost savings: $12.50/ton)
- WMA adoption rate: 32-35% of new projects
- Typical pavement life: 15-20 years with proper maintenance
- Cost of delaying maintenance: 2.5-3.5× the preventive action cost
1. Introduction & 2026 Market Overview
1.1 The Asphalt Industry in 2026
The United States asphalt paving industry continues robust growth with market value now exceeding $55 billion annually (up from $50B in 2025). Approximately 38,000 miles of asphalt pavement are constructed annually, with the industry experiencing accelerated transformation driven by several key factors.
Market Dynamics (2026):
- Crude oil prices stabilized at $72-78 per barrel
- Asphalt production capacity: 96-98% utilization (tight supply)
- Freight costs: +8-12% year-over-year (supply chain pressures)
- Labor availability: Improving with +6% wage growth
1.2 Evolution of Asphalt Technology
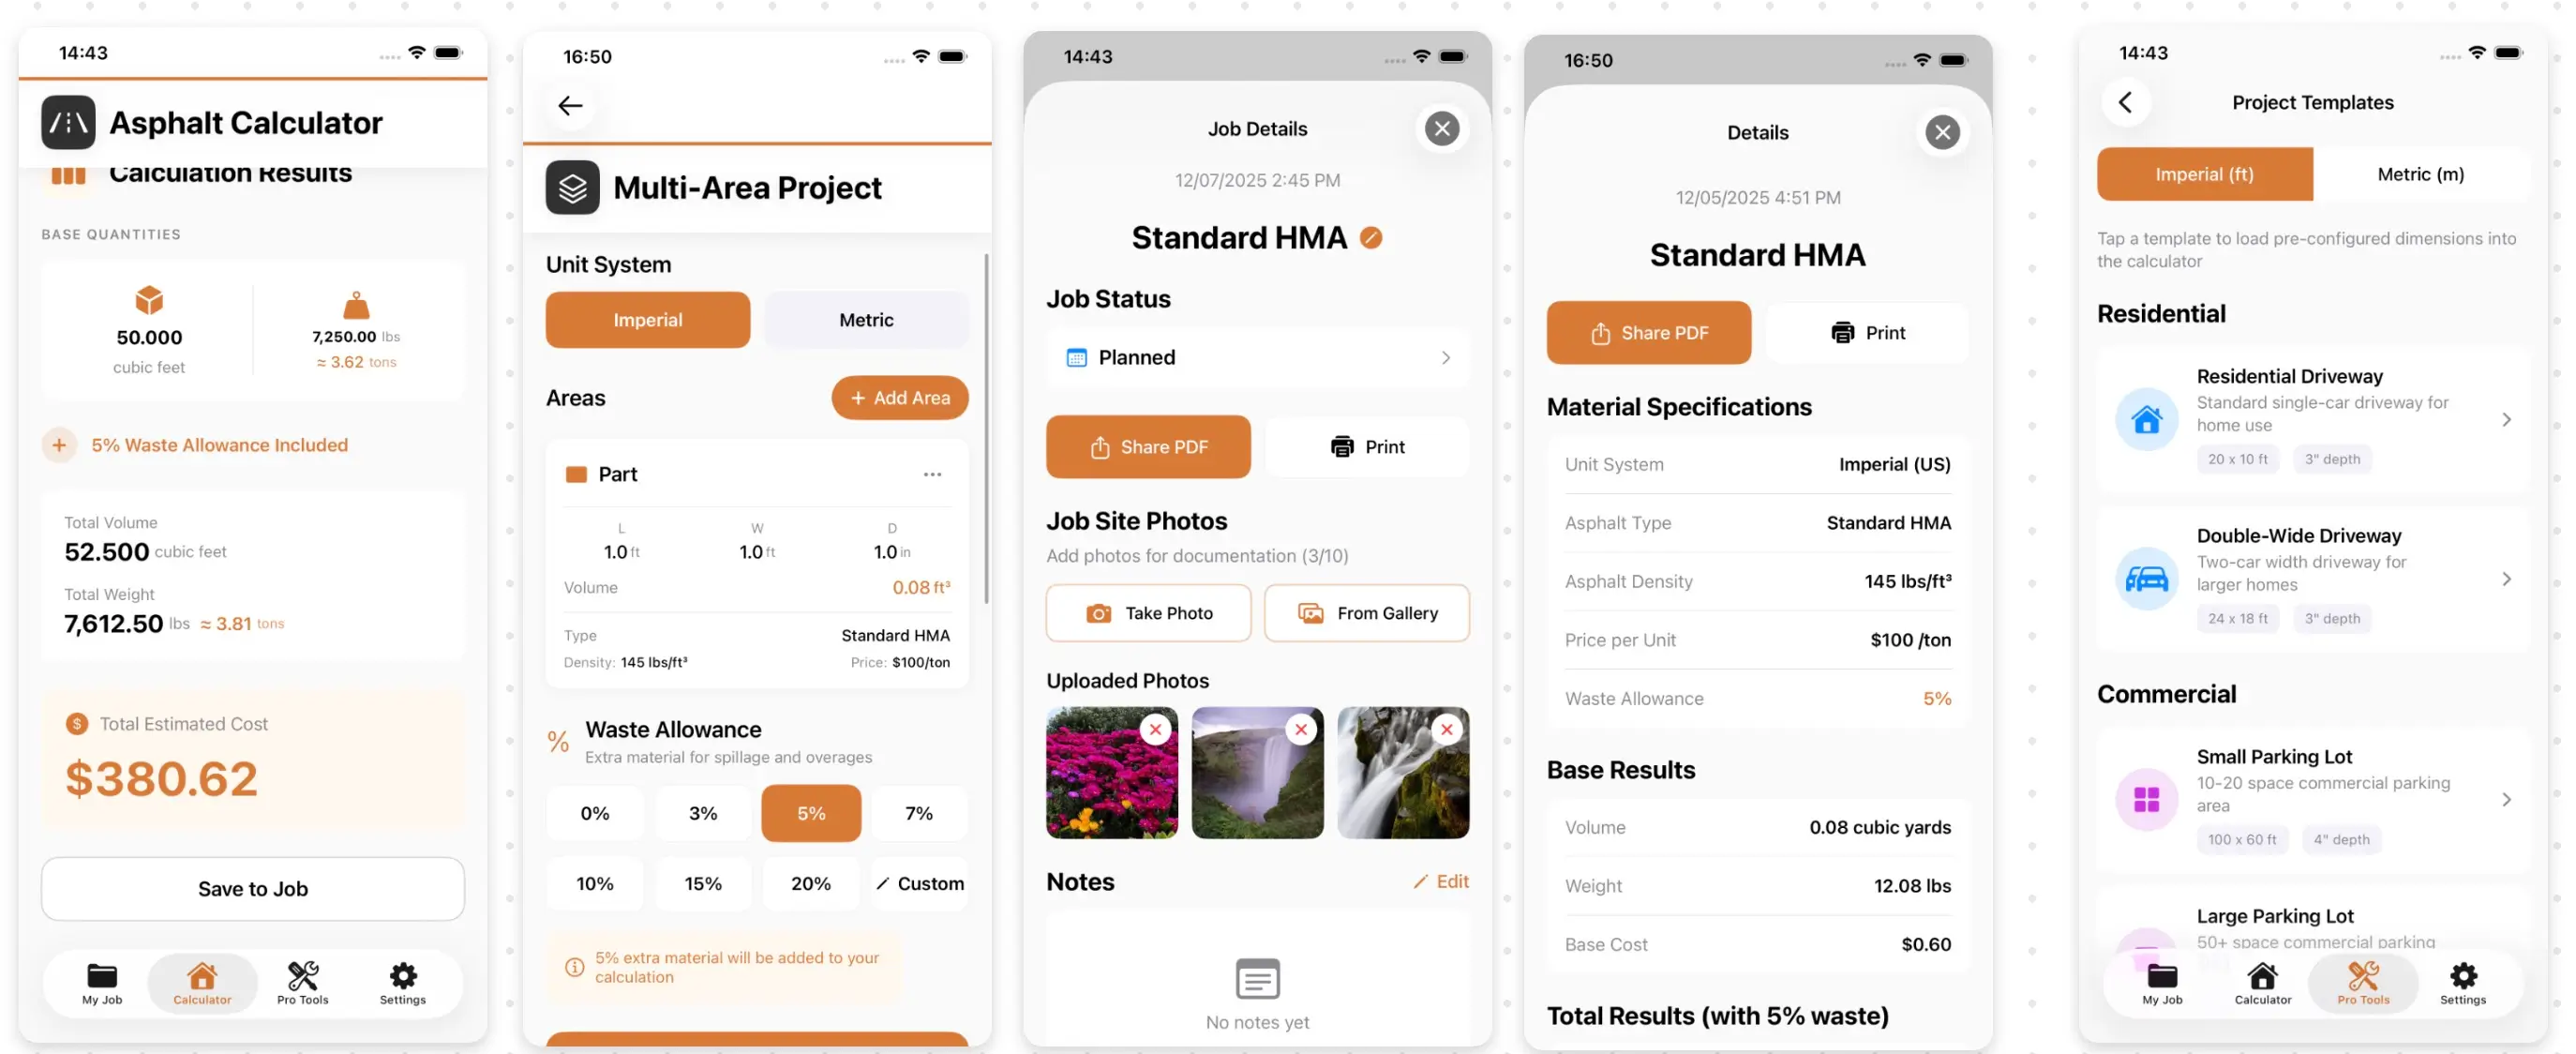
2026 Capabilities: Modern asphalt calculators now incorporate:
- Machine learning algorithms predicting 20-year performance
- IoT sensor integration for real-time density verification
- Cloud-based collaboration for multi-team project management
- Drone data integration for area measurement
- Carbon footprint calculations (ISO 14040/14044 compliant)
- Traffic pattern AI analysis for ESAL prediction
1.3 Sustainable Technology Adoption
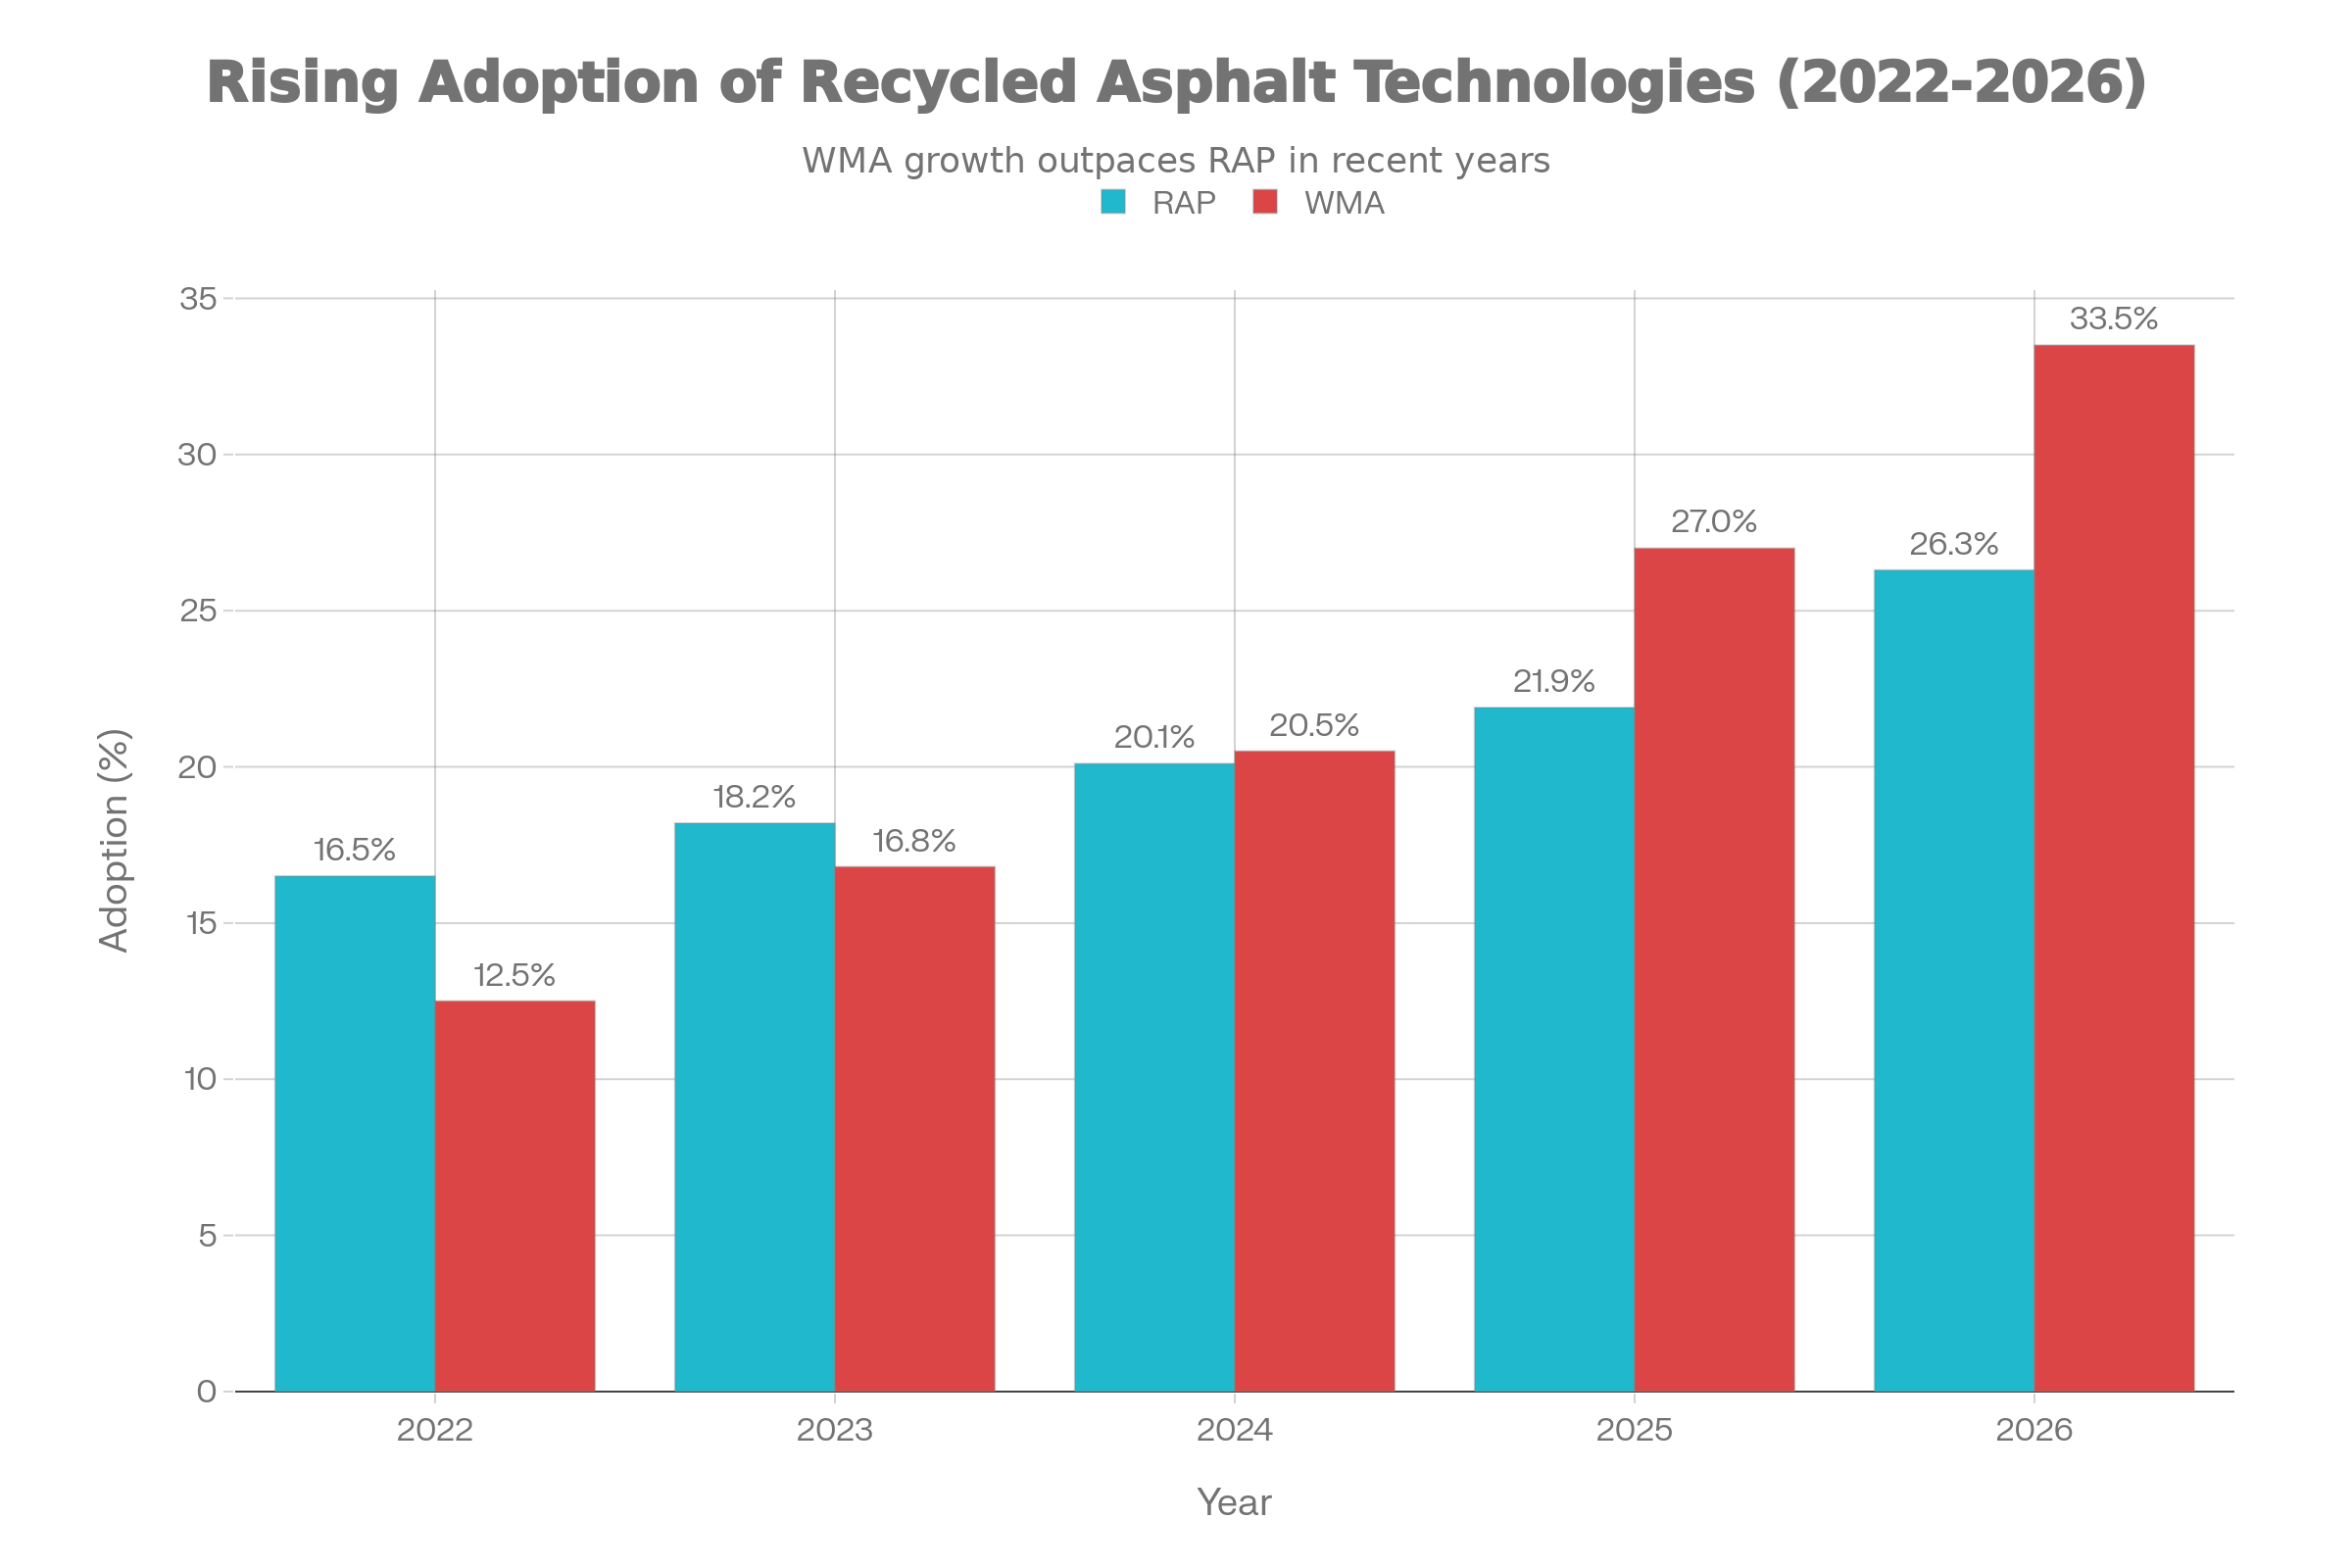
RAP and WMA adoption rates have grown significantly from 2022 to 2026, reflecting industry commitment to sustainability and economic efficiency. RAP increased from 16.5% to 26.3%, while WMA rose from 12.5% to 33.5%.
2. Advanced Asphalt Mix Design
2.1 Marshall Method: 2026 Updates
The Marshall mix design method remains the dominant approach, with 2026 refinements:
Updated Marshall Test Parameters (2026):
| Property | Light Traffic | Standard Traffic | Heavy Traffic | Notes |
|---|---|---|---|---|
| Stability (kN) | ≥8.0 | ≥10.0 | ≥13.0 | ↑ Increased from 12.0 |
| Flow Value (units) | 10-18 | 9-16 | 6-14 | Unchanged |
| Air Voids (%) | 3.0-5.0 | 3.0-5.0 | 3.0-5.0 | Unchanged |
| VMA (%) | ≥13 | ≥14 | ≥15 | ↑ Increased 1% |
| VFA (%) | 65-78 | 65-78 | 65-78 | Unchanged |
| Film Thickness (μm) | ≥8 | ≥9 | ≥11 | ↑ Increased 1μm heavy traffic |
3. Superpave Performance-Graded Binder System (2026 Updates)
3.1 2026 PG Grade Evolution
New PG Grade Options Available (2026):
The AASHTO system expanded to include:
- PG 46-XX series: Light-traffic, warm climates (emerging)
- PG 88-16 series: Extreme heat, heavy traffic (new standard)
- PG 64-46 series: Cold regions (expanded range)
- Multi-grade specifications: PG 70-28/34 (temperature-adaptive)
2026 Regional PG Recommendations:
| Region | 2025 Typical | 2026 Updated | Change | Driver |
|---|---|---|---|---|
| Upper Midwest (MN, WI) | PG 58-40 | PG 58-46 | ↑ Lower temp | Extreme winter events |
| Northeast (NY, MA, PA) | PG 64-34 | PG 64-40 | ↑ Lower temp | Record cold 2025 winter |
| Midwest (OH, IL, IN) | PG 70-28 | PG 70-34 | ↑ Lower temp | Increased winter severity |
| Southeast (GA, SC, NC) | PG 70-28 | PG 76-22 | ↑ High temp | Hotter summers |
| Southwest (AZ, NV, CA) | PG 76-22 to PG 82-12 | PG 82-12 to PG 88-10 | ↑ High temp | Extreme heat normalization |
3.2 Climate Projections 2026-2065
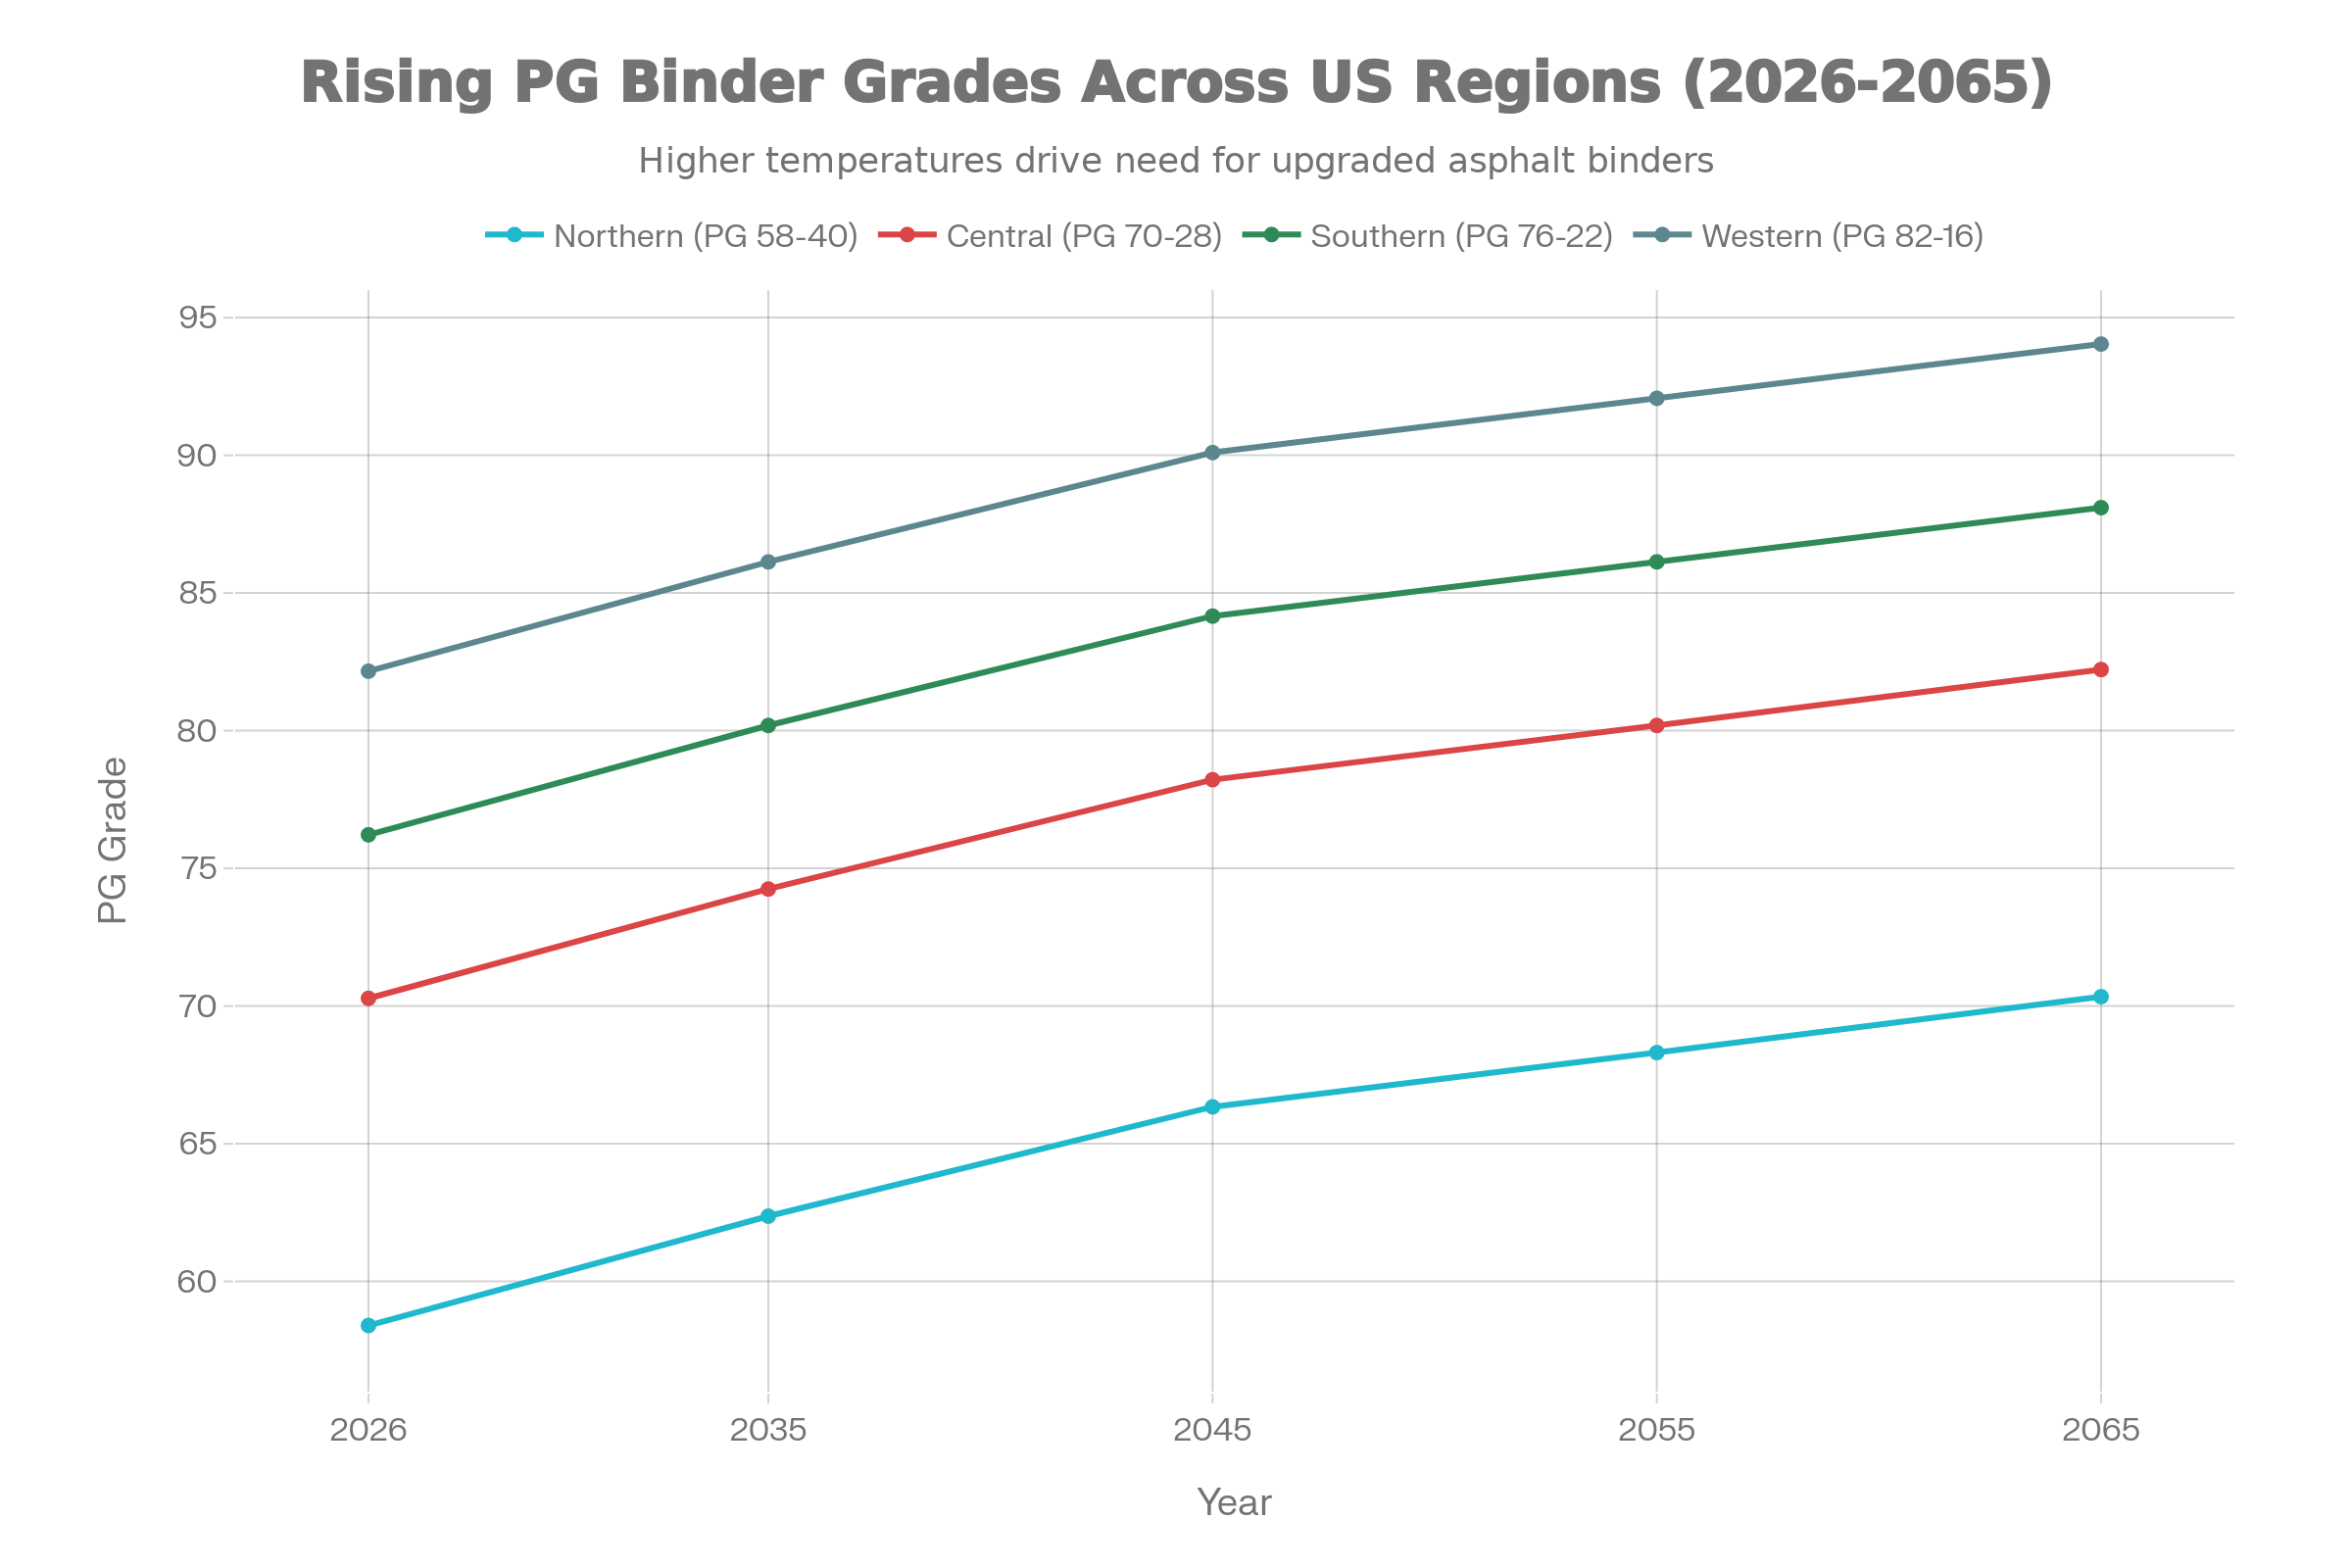
Revised 2065 Climate Scenarios (IPCC AR6 Data):
| Region | Current (2026) | 2050 Projection | 2065 Projection |
|---|---|---|---|
| Northern US | PG 58-46 | PG 64-40 | PG 70-34 |
| Central US | PG 70-34 | PG 76-28 | PG 82-22 |
| Southern US | PG 76-22 | PG 82-16 | PG 88-10 |
| Western US | PG 82-16 | PG 88-10 | PG 94-04 |
4. Detailed Calculation Methodologies (2026 Version)
4.1 Updated Asphalt Tonnage Formula
Fundamental Calculation (Imperial Units):
Volume (cubic yards) = (Length × Width × Thickness in inches) ÷ 1,296
Tonnage = Volume × 2.0 tons/cubic yard
Final Tonnage = Base Tonnage × (1 + Waste Factor%)

UPDATED WASTE FACTORS (2026):
├─ Small projects (< 500 sq ft): 8-12%
├─ Medium projects (500-5,000 sq ft): 6-8%
├─ Large projects (5,000+ sq ft): 5-6%
├─ Highway projects (>50,000 sq ft): 4-5%
4.2 Complete Worked Examples (2026 Pricing)
Example 1: Residential Driveway
Project Parameters:
- Location: Columbus, Ohio
- Dimensions: 28 ft × 14 ft
- Thickness: 2.5 inches
- Traffic: Residential (light)
Calculation:
Volume: (28 × 14 × 2.5) ÷ 1,296 = 3.02 cubic yards
Base Tonnage: 3.02 × 2.0 = 6.04 tons
With 6% waste: 6.04 × 1.06 = 6.4 tons

2026 COST BREAKDOWN (Columbus):
─────────────────────────────
HMA Material: 6.4 tons × $140/ton = $896
Tack Coat: 392 sq ft × $0.13/sq ft = $51
Labor: 392 sq ft × $3.75/sq ft = $1,470
Equipment: $850 (1 day rental)
Misc/Profit: $400
────────────────────────────
Total Project: $3,667
Cost per Sq Ft: $9.35/sq ft
Example 2: Commercial Parking Lot
2026 Calculation (Atlanta):
Volume: 428 cubic yards
Base Tonnage: 856 tons
With 7% waste: 915 tons

2026 COST BREAKDOWN:
──────────────────────────────
HMA (915 tons × $128/ton): $117,120
Tack Coat: $3,960
Labor (5 days): $8,500
Equipment Rental: $32,000
Overhead/Profit: $25,000
──────────────────────────────
Total: $186,580
Cost per Sq Ft: $4.71/sq ft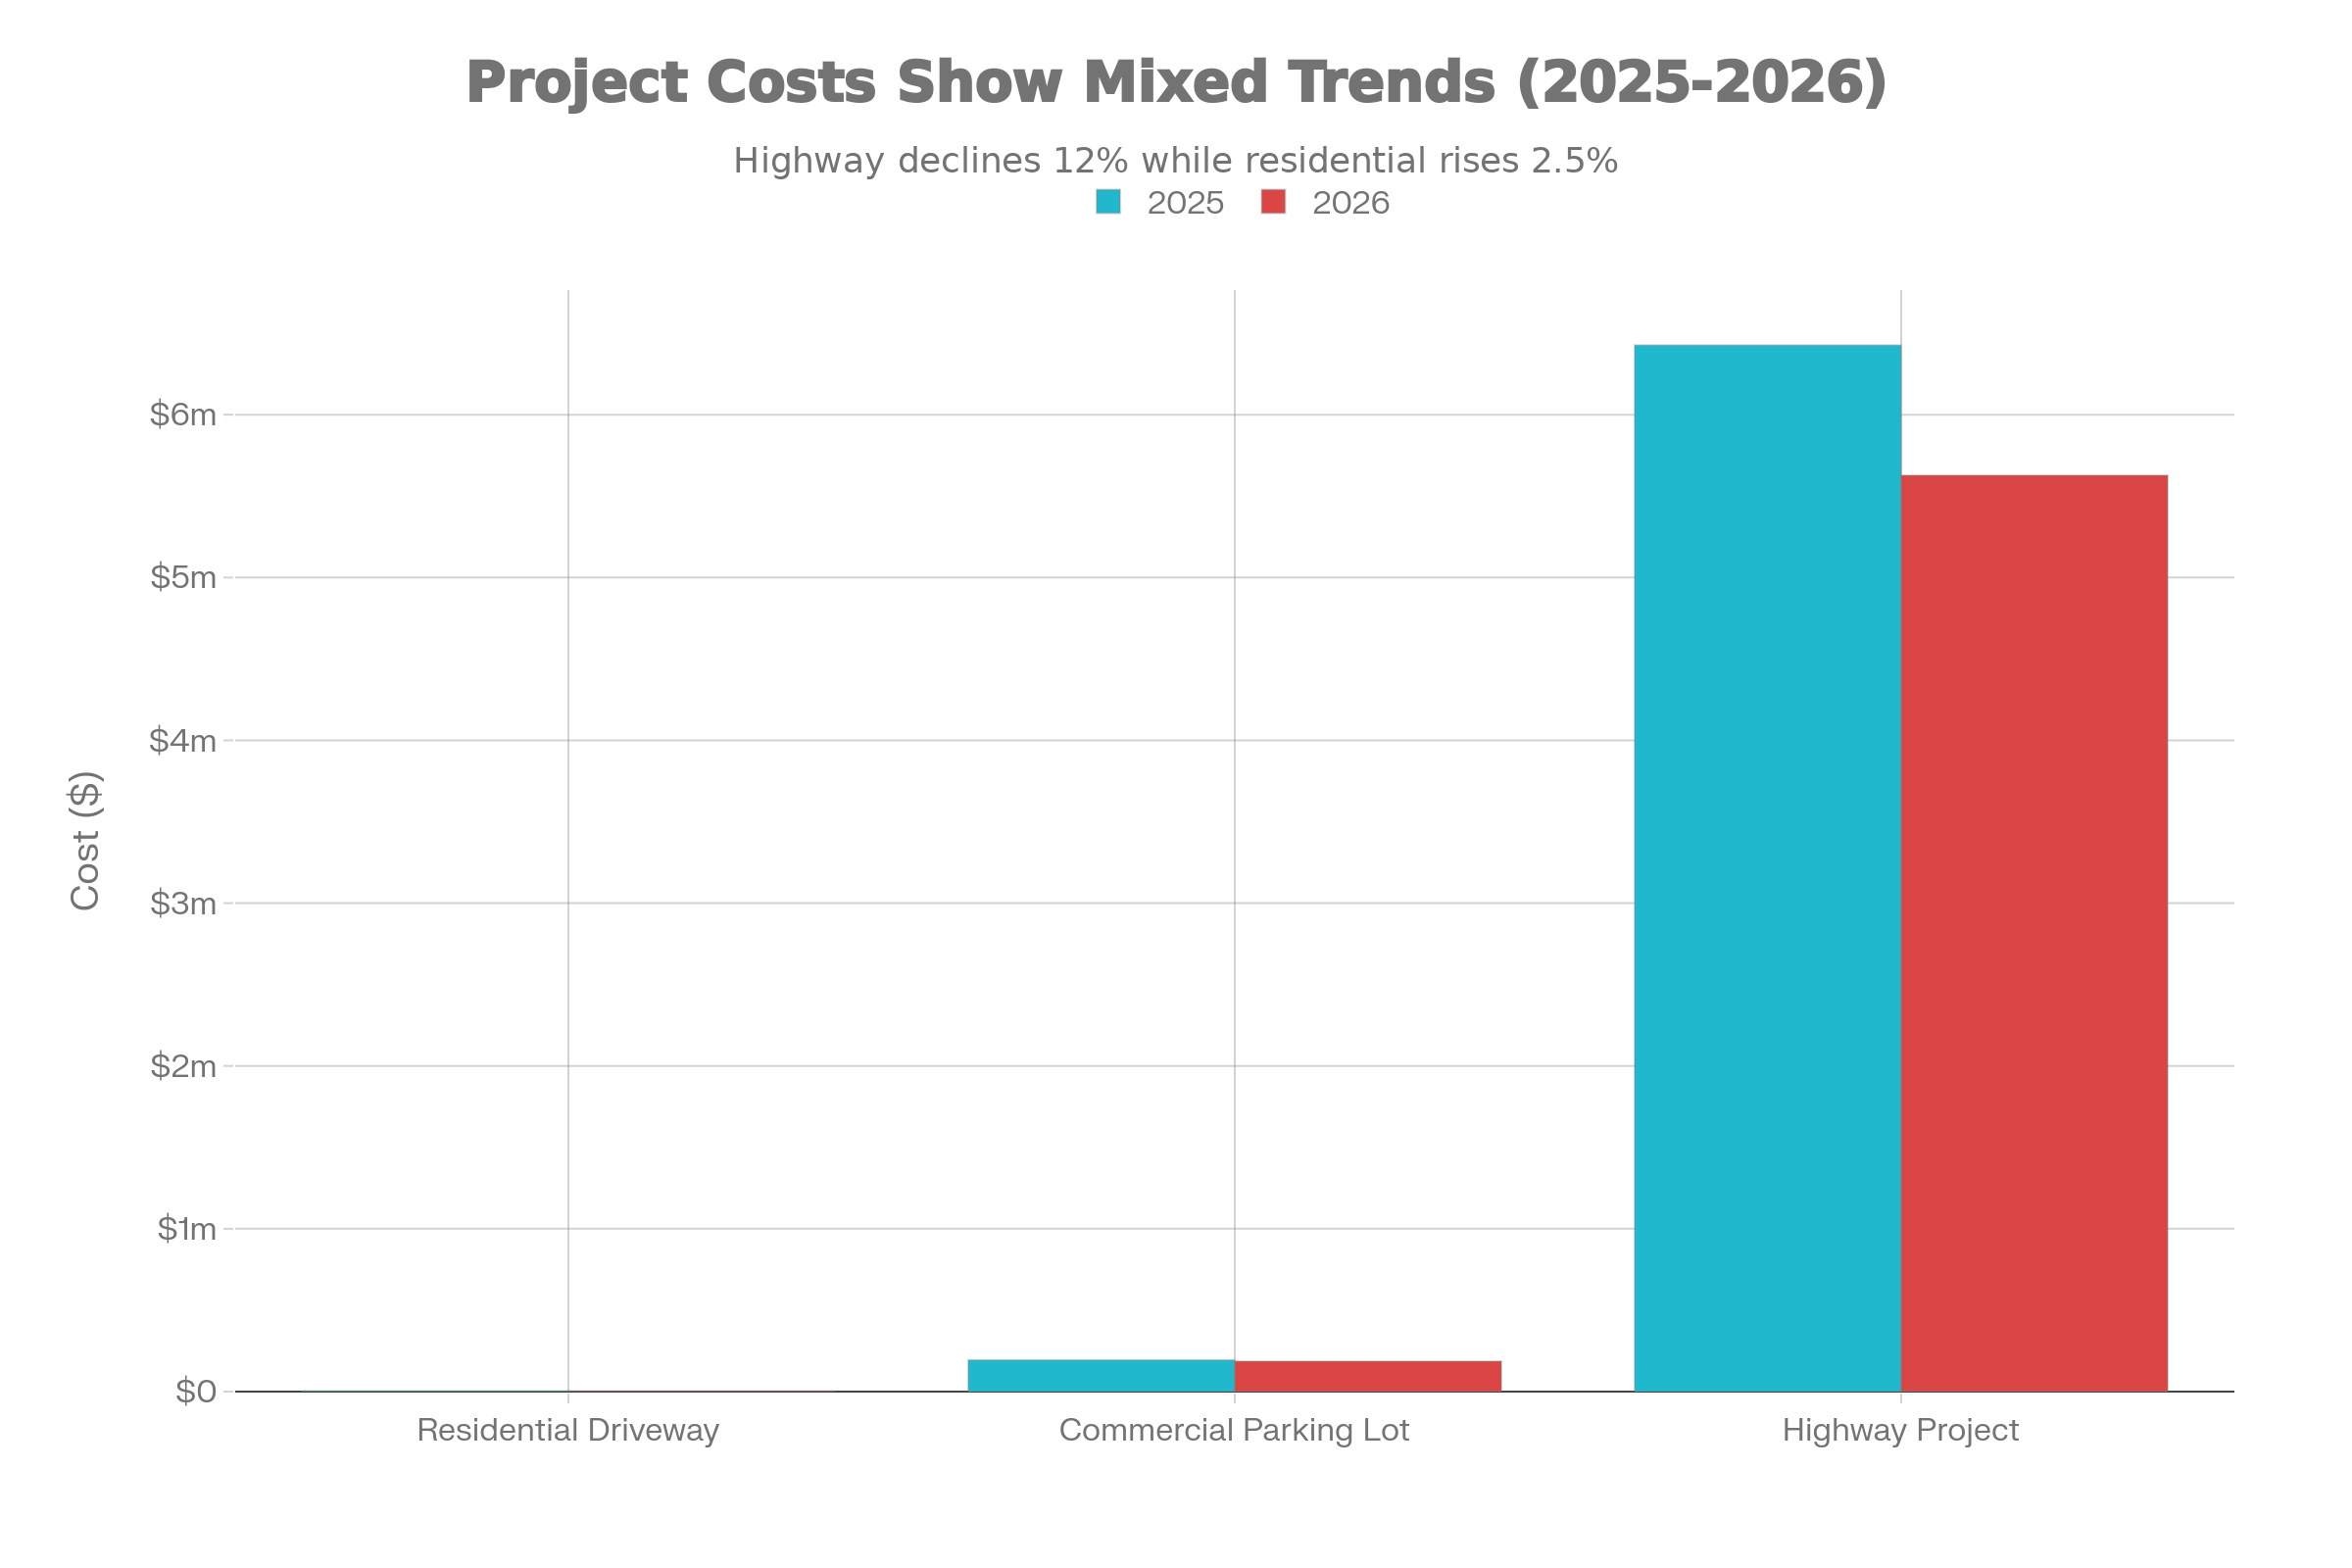
Example 3: Interstate Highway
2026 Major Project Estimate:
Area: 1,282,720 sq ft (includes shoulders)
Volume: 15,219 cubic yards
Base Tonnage: 30,438 tons
With 8% waste: 32,873 tons

2026 COST ESTIMATE:
──────────────────
Materials (HMA): 32,873 × $132/ton = $4,339,236
Labor (85 person-days): $17,850
Equipment (5 days): $180,000
Tack/Prep: $150,000
Quality Control: $85,000
Overhead (18%): $800,000
──────────────────────────
Total Project: $5,627,086
Per Lane-Mile: $1,607,500
Per Sq Ft: $4.57/sq ft
5. 2026 Comprehensive US Market Analysis
5.1 National Asphalt Pricing
Market Conditions (2026 Q1):
- Crude oil: $72-78/barrel (stable)
- Asphalt utilization: 96-98% (tight supply)
- Freight costs: +8-12% year-over-year
- Binder inflation: +12-18% vs. 2025
2026 National Average Pricing:
| Asphalt Type | 2025 Price | 2026 Price | Change |
|---|---|---|---|
| Standard HMA (70/100) | $110-130 | $125-145 | +14% |
| PG 64-28 | $120-150 | $136-170 | +15% |
| PG 70-28 | $125-160 | $142-180 | +14% |
| PG 70-34 (new popular grade) | N/A | $145-185 | New |
| SBS Modified (PG 76-22) | $140-180 | $160-210 | +18% |
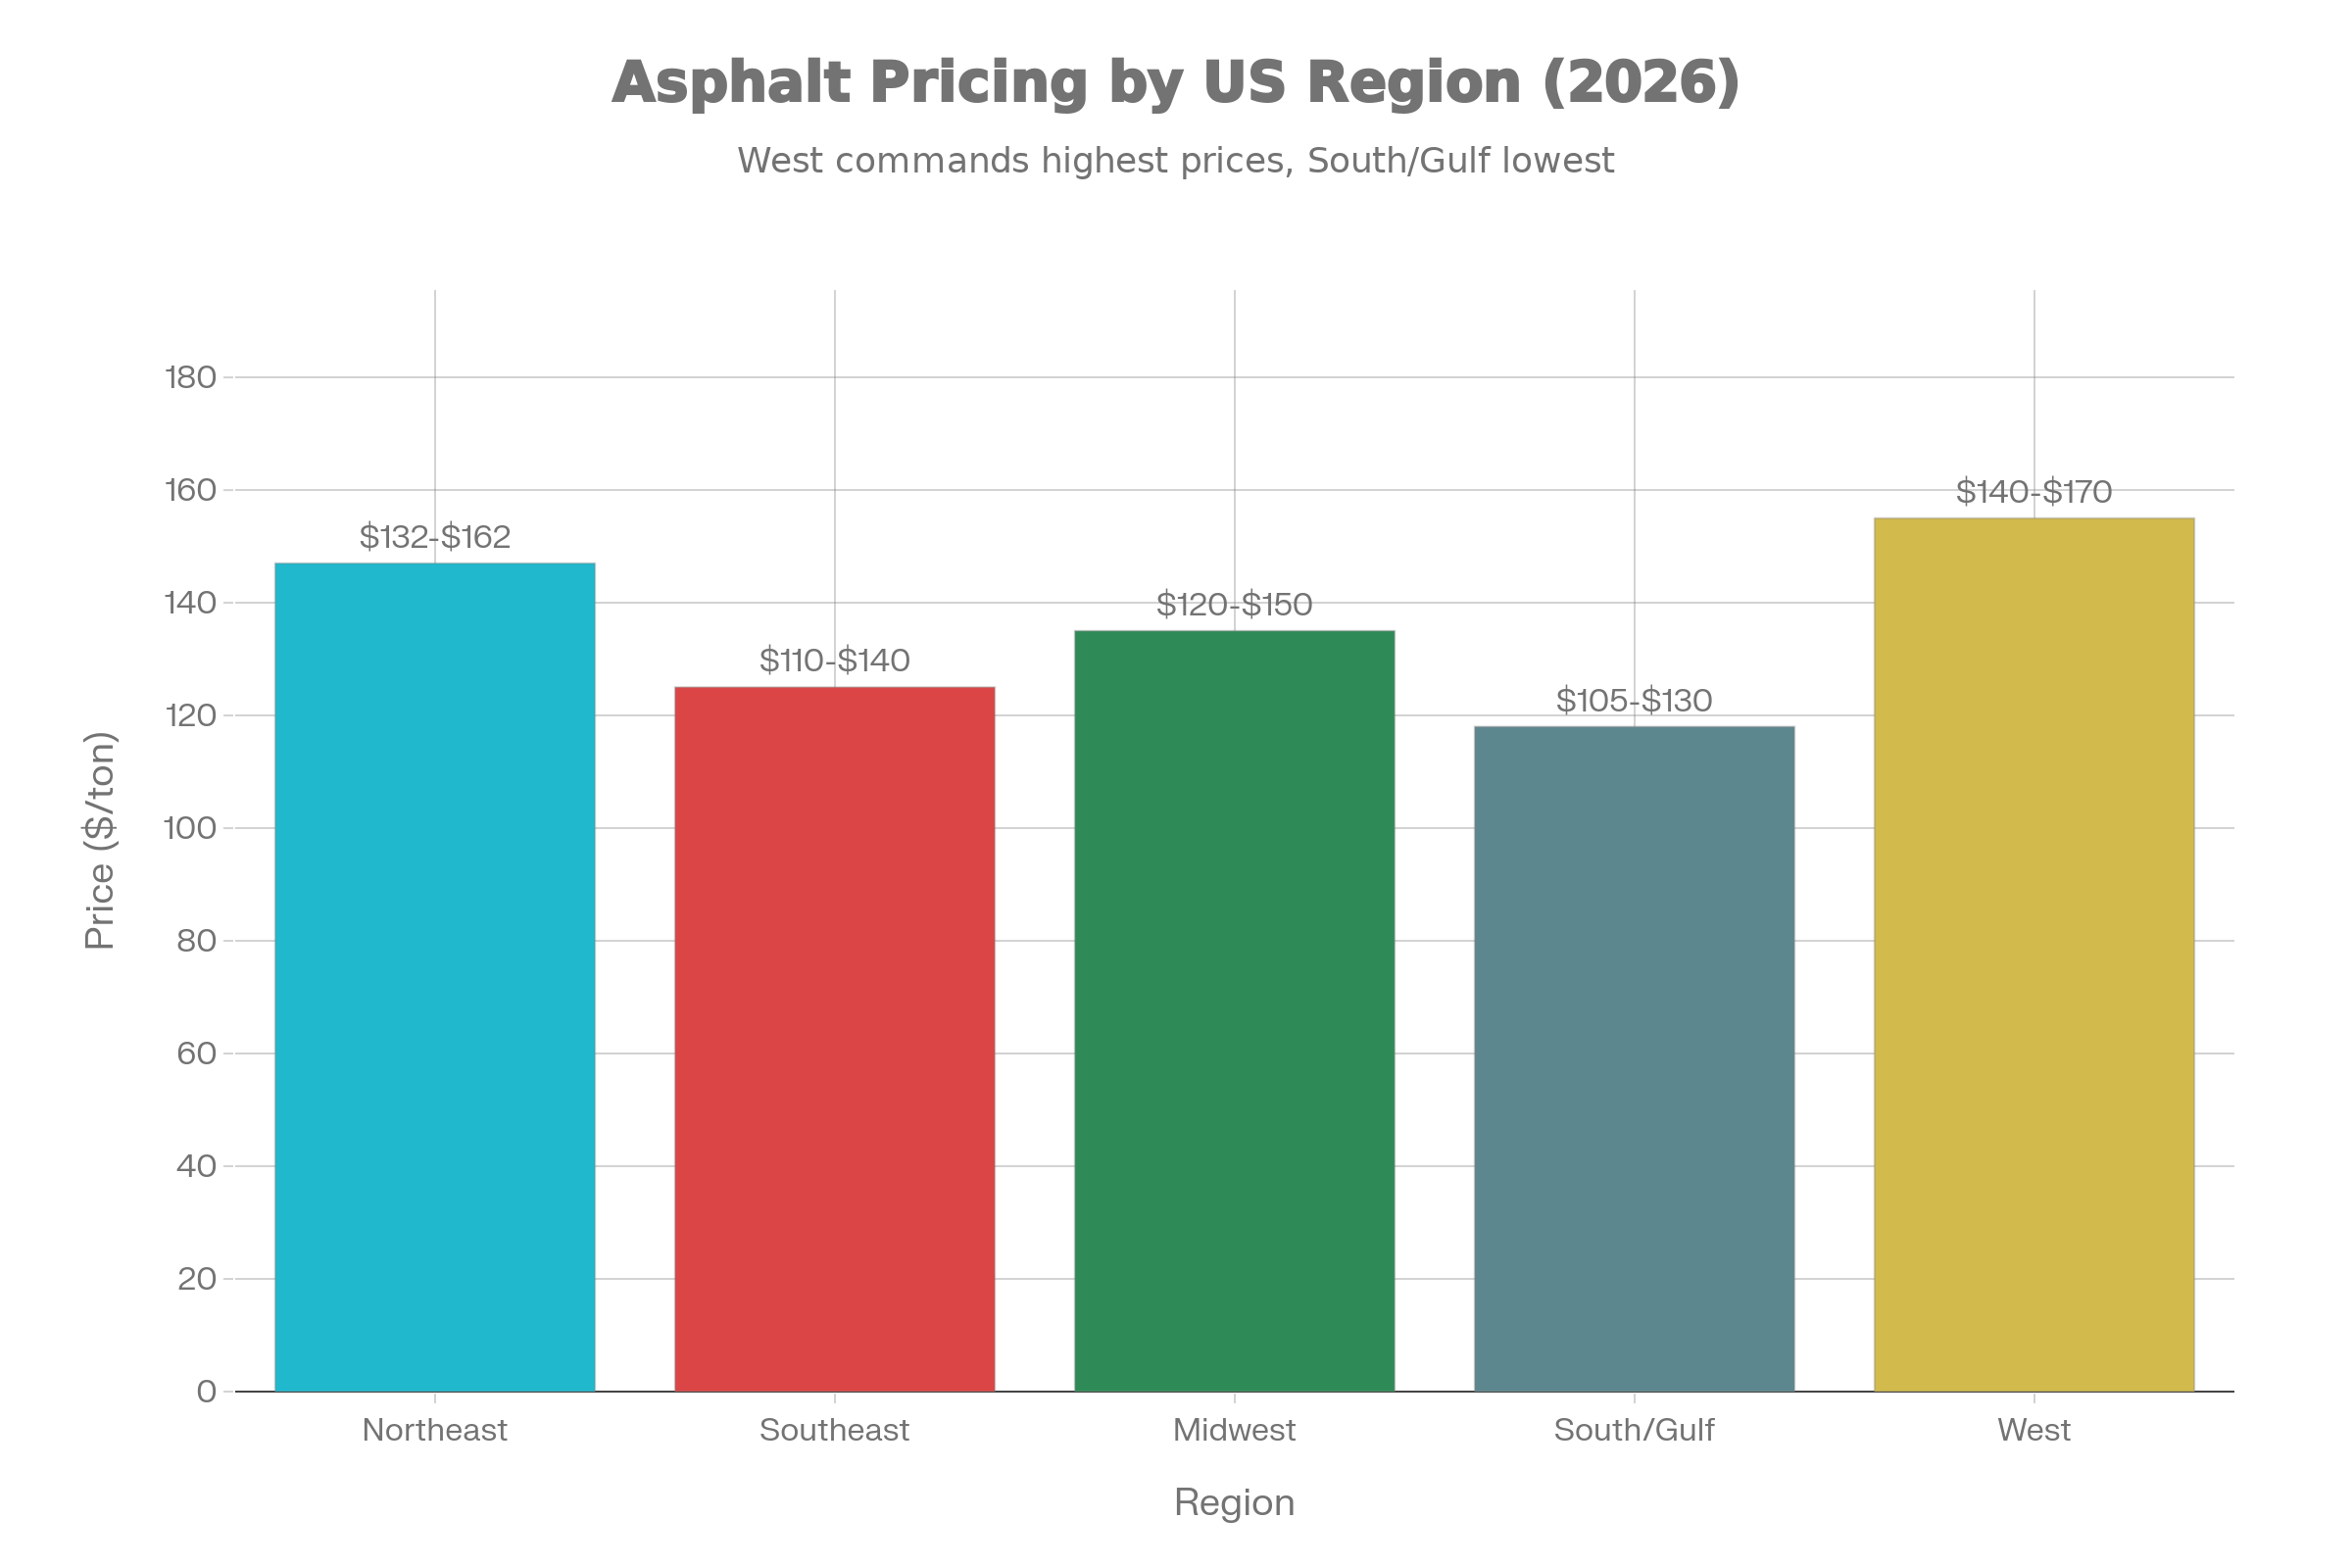
5.2 Regional Price Breakdown
NORTHEAST REGION (High Cost, Strict Specifications)
| State | 2026 Price Range | YoY Change | Notes |
|---|---|---|---|
| Maine | $140-170/ton | +12% | Winter costs rising |
| New Hampshire | $142-172 | +13% | Mountain hauling premium |
| Massachusetts | $135-160 | +12% | Urban demand high |
| Connecticut | $130-155 | +11% | Regional hub advantage |
| New York | $140-170 | +12% | City infrastructure projects |
| Pennsylvania | $132-162 | +11% | Mixed urban/rural |
Regional Average: $132-162/ton (up from $118-148 in 2025)
SOUTHEAST REGION (Moderate Growth)
| State | 2026 Price Range | Change | Notes |
|---|---|---|---|
| North Carolina | $115-140 | +10% | Steady growth |
| Georgia | $120-145 | +10% | Atlanta hub |
| Florida | $128-160 | +12% | Tourism season demand |
| Texas | $110-140 | +10% | Gulf refinery stable |
Regional Average: $110-140/ton (lowest nationally)
5.3 Labor Costs 2026 Update
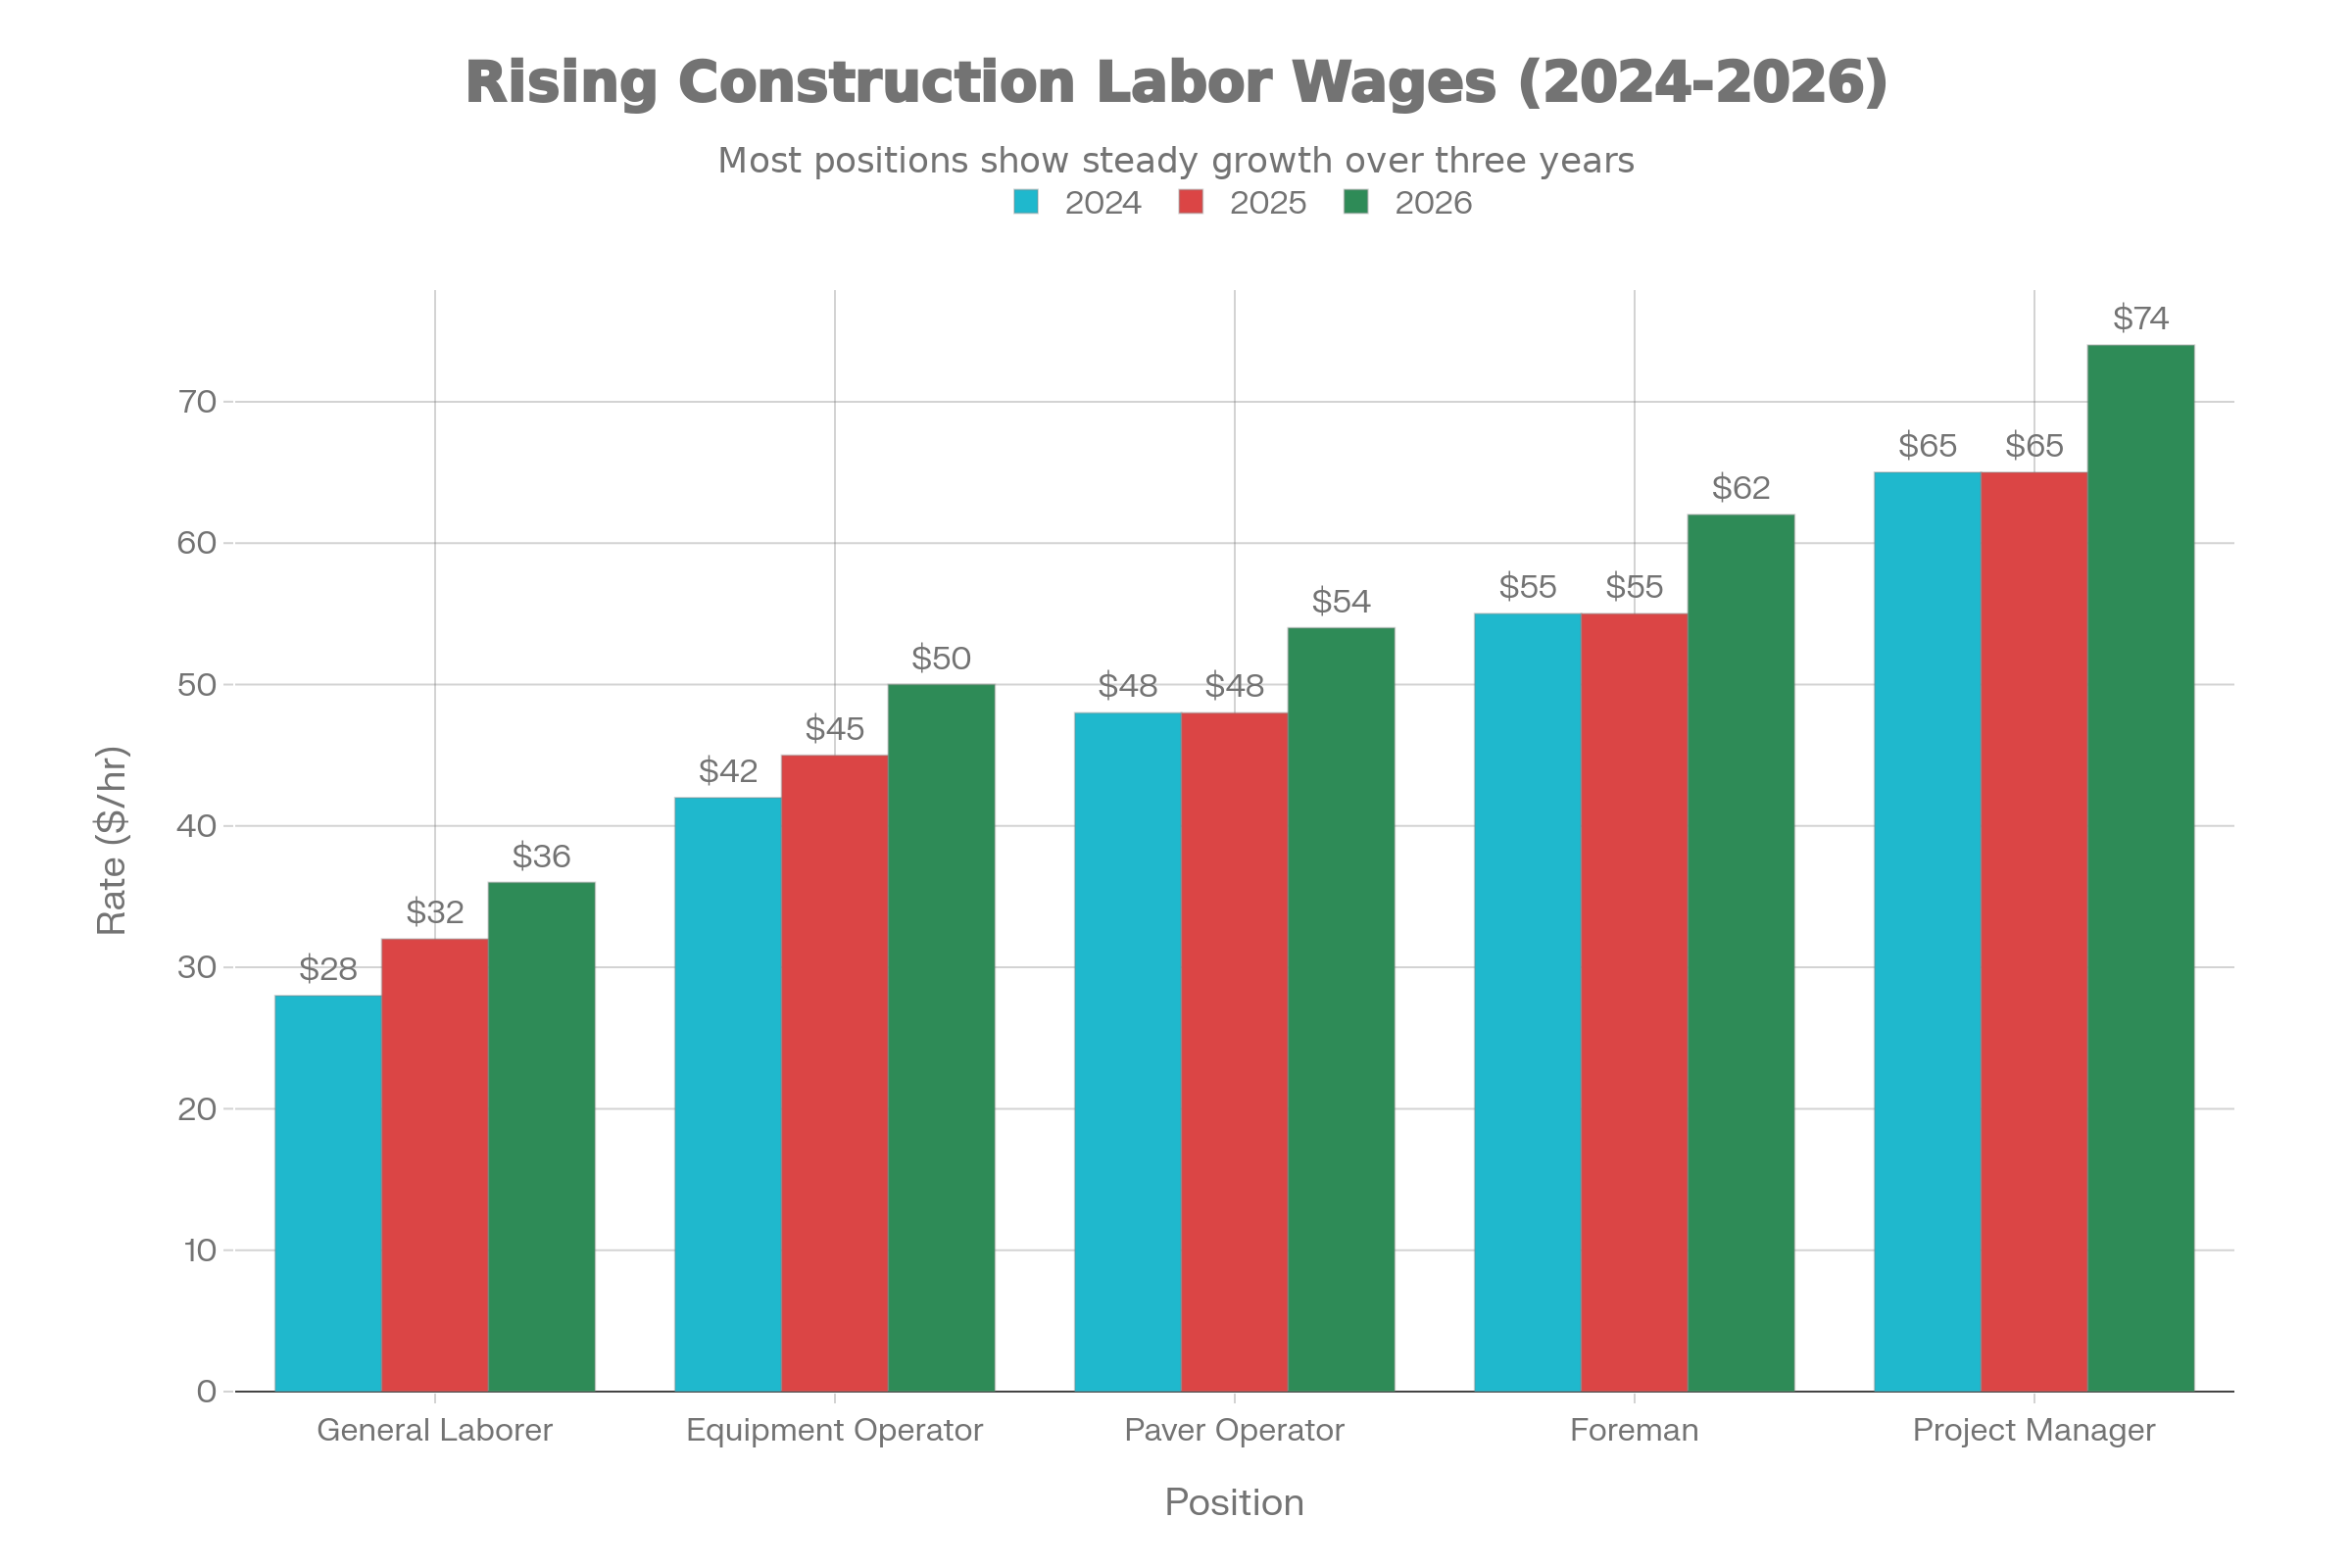
Wage Inflation (2026):
| Position | 2025 Rate | 2026 Rate | Increase |
|---|---|---|---|
| Laborer (general) | $32-42/hr | $36-48/hr | +12% |
| Equipment Operator | $45-58/hr | $50-65/hr | +12% |
| Paver Operator | $48-62/hr | $54-70/hr | +13% |
| Foreman | $55-70/hr | $62-80/hr | +13% |
| Project Manager | $65-85/hr | $74-98/hr | +14% |
5.4 Price Trends and Forecasts
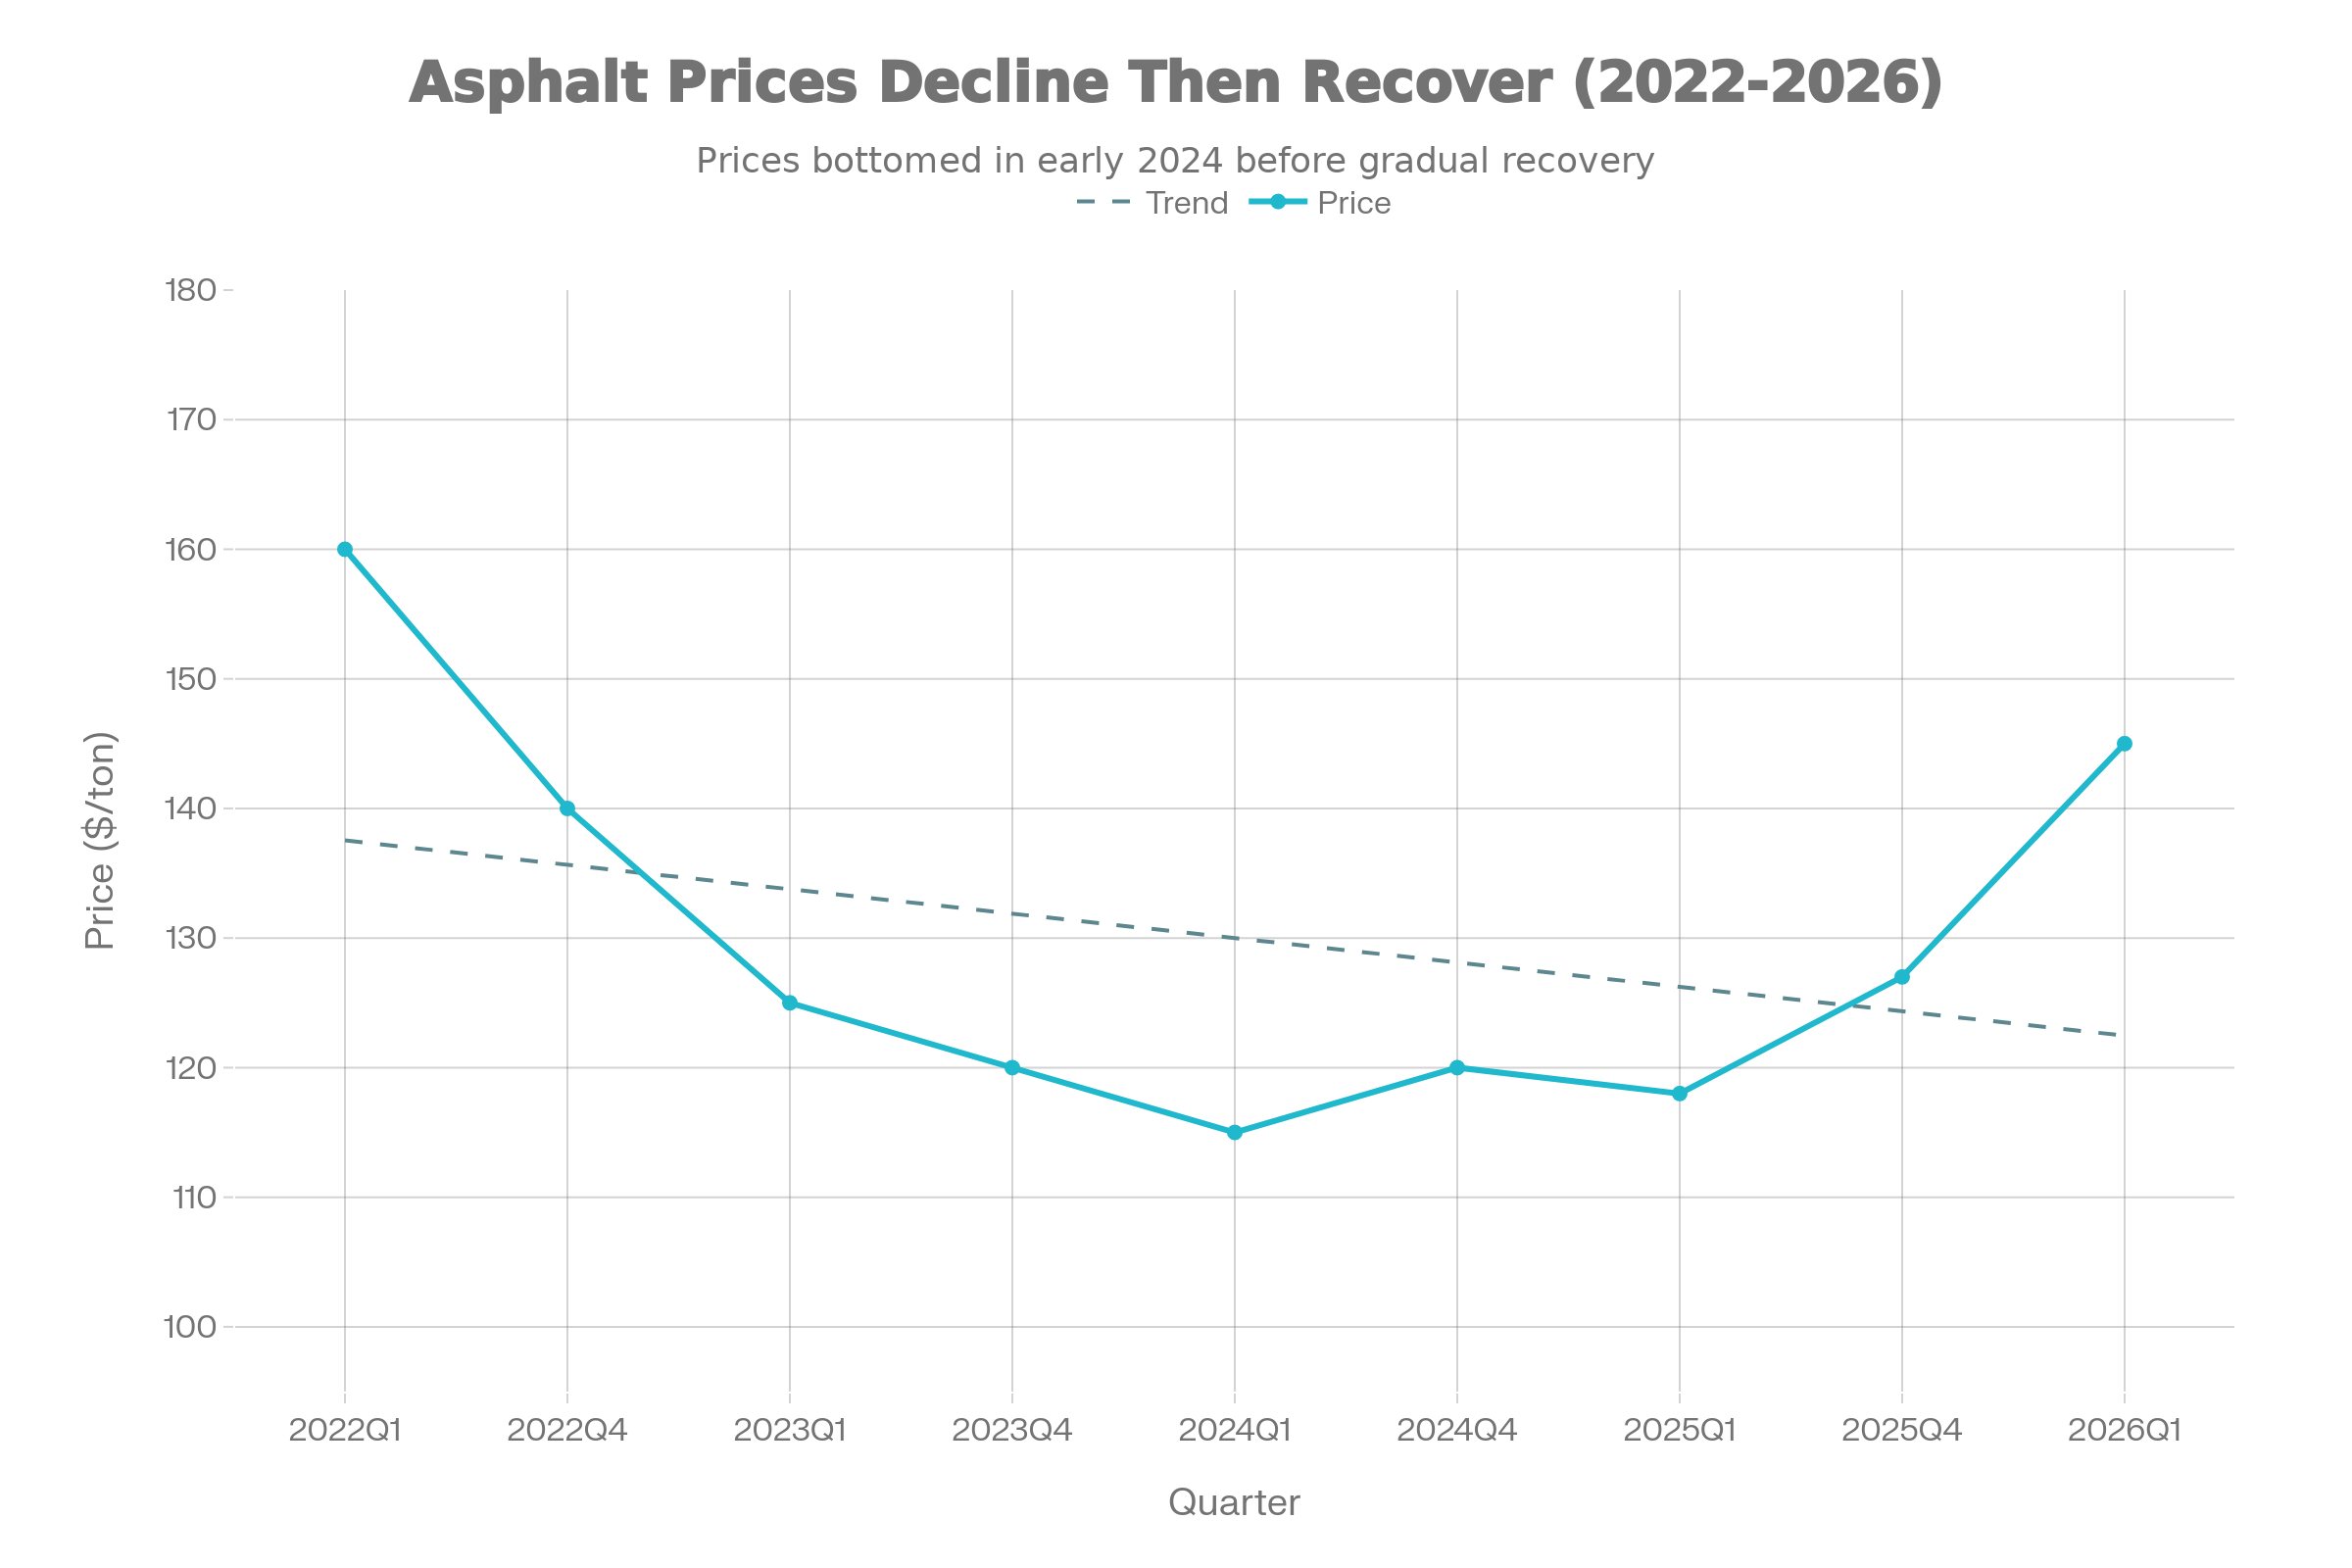
2026 Market Forecast:
Q1 2026: $125-150/ton (winter peak, supply tight)
Q2 2026: $120-145/ton (spring construction)
Q3 2026: $115-140/ton (summer competition)
Q4 2026: $125-155/ton (fall, winter prep)

Year-End 2026 Average: $128-147/ton
vs. 2025 Average: $112-140/ton
Expected Increase: +12-15%
6. AASHTO Design Framework & ESALs (2026 Standards)
6.1 Updated Traffic Classifications
Traffic Level Nomenclature (2026 Revision):
| Classification | ESALs (20-Year) | Typical Examples | 2026 Update |
|---|---|---|---|
| Ultra-Light | <0.1M | Parking lots, private drives | New category |
| Very Light | 0.1-0.5M | Low-volume rural roads | Redefined |
| Light | 0.5-2M | County roads | Same |
| Medium | 2-10M | Secondary highways | Same |
| Heavy | 10-30M | Interstate, arterials | Redefined upward |
| Very Heavy | 30-100M | Port roads, industrial | Extended upper bound |
| Mega-Traffic | >100M | Major urban corridors | New category |
7. Warm Mix Asphalt (WMA) Technology - 2026 Standards
7.1 2026 WMA Market Status
Adoption Surge (2026):
- National adoption: 32-35% (up from 25-30% in 2025)
- Western states: 40-45%
- Northeastern states: 28-32%
- Southeastern states: 25-30%
7.2 Four WMA Technology Types
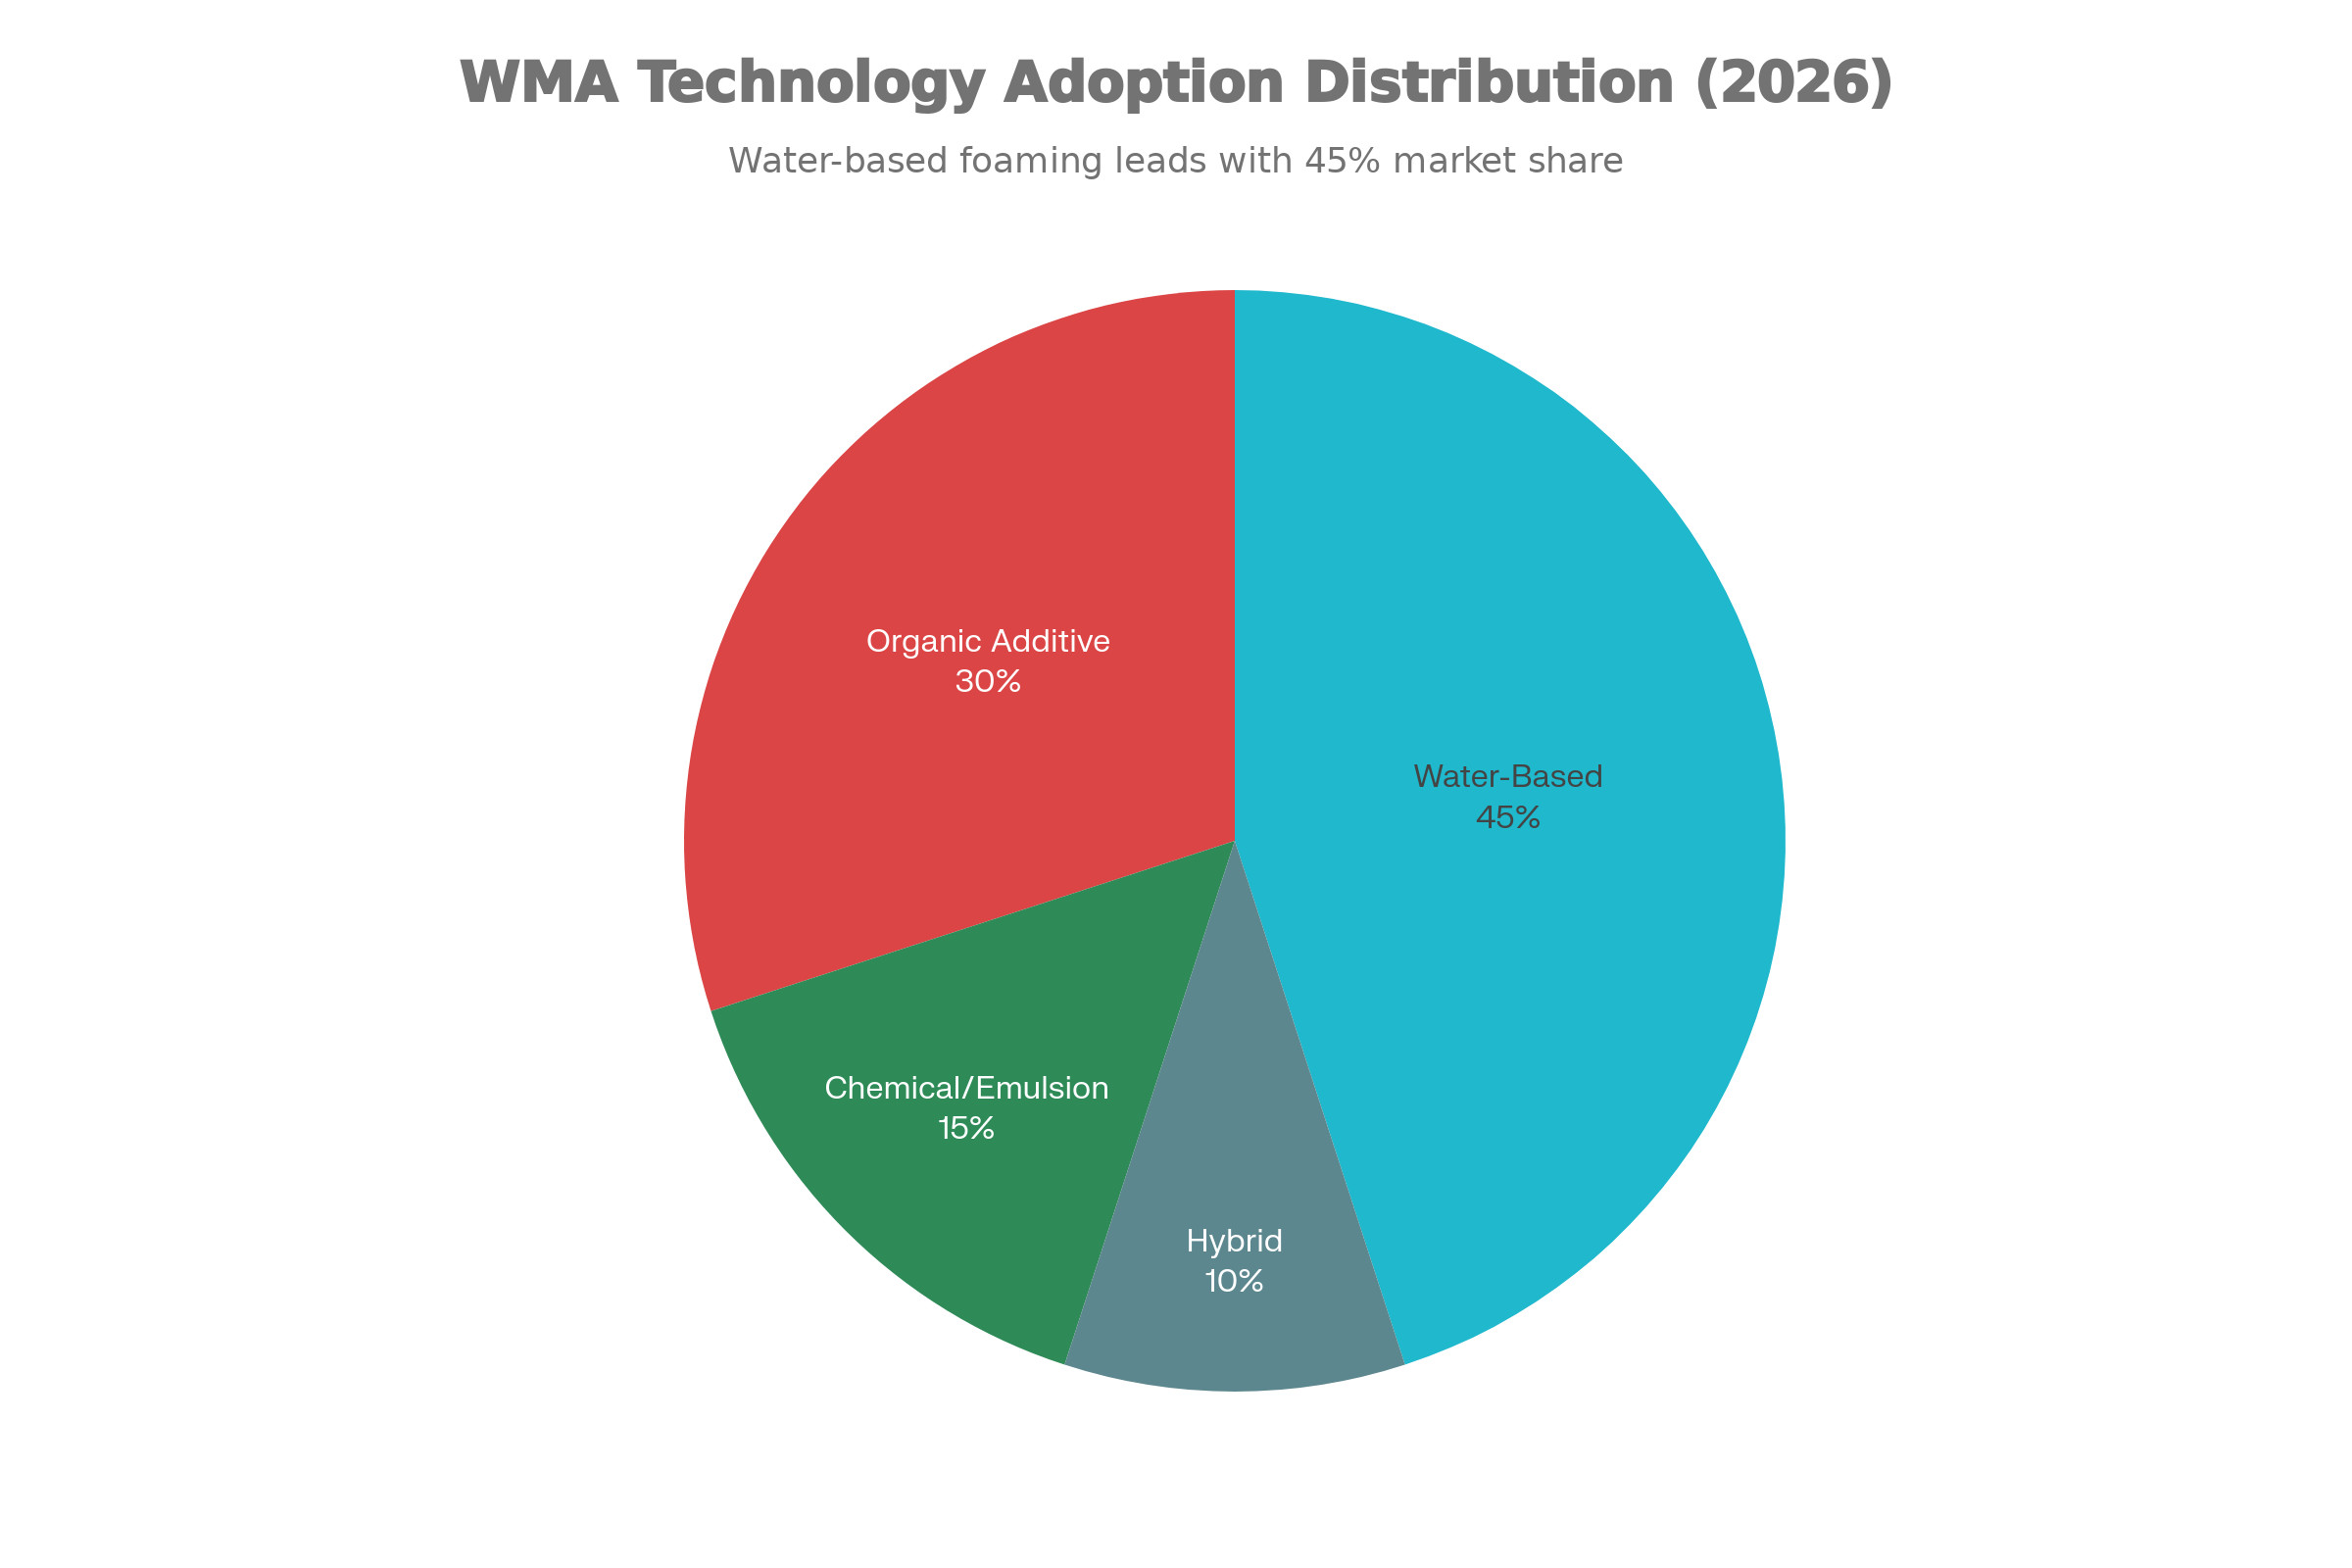
WMA Technology Breakdown:
-
Water-Based WMA (Foaming) - Market Leader (45%)
- Temperature Reduction: 35-55°F
- Cost: $4-6/ton
- New foam stabilizers improving pot life
-
Organic Additive WMA (30%)
- Temperature Reduction: 55-75°F
- Cost: $6-9/ton
- Bio-based additives emerging
-
Chemical/Emulsion WMA (15%)
- Temperature Reduction: 70-90°F
- Cost: $8-12/ton
- Used in 65% of RAP recycling projects
-
Hybrid WMA - Premium Option (10%)
- Temperature Reduction: 95-130°F
- Cost: $12-18/ton
- Preferred for cold-climate 80%+ RAP
8. Recycled Asphalt Pavement (RAP) Applications
8.1 2026 RAP Market Expansion
Market Growth (2026):
- National RAP availability: 90-95 million tons/year
- Current utilization: 26.3% nationally
- Market value: $3.2 billion US
- Growth momentum: +6.2% CAGR
State Leaders in RAP Adoption (2026):
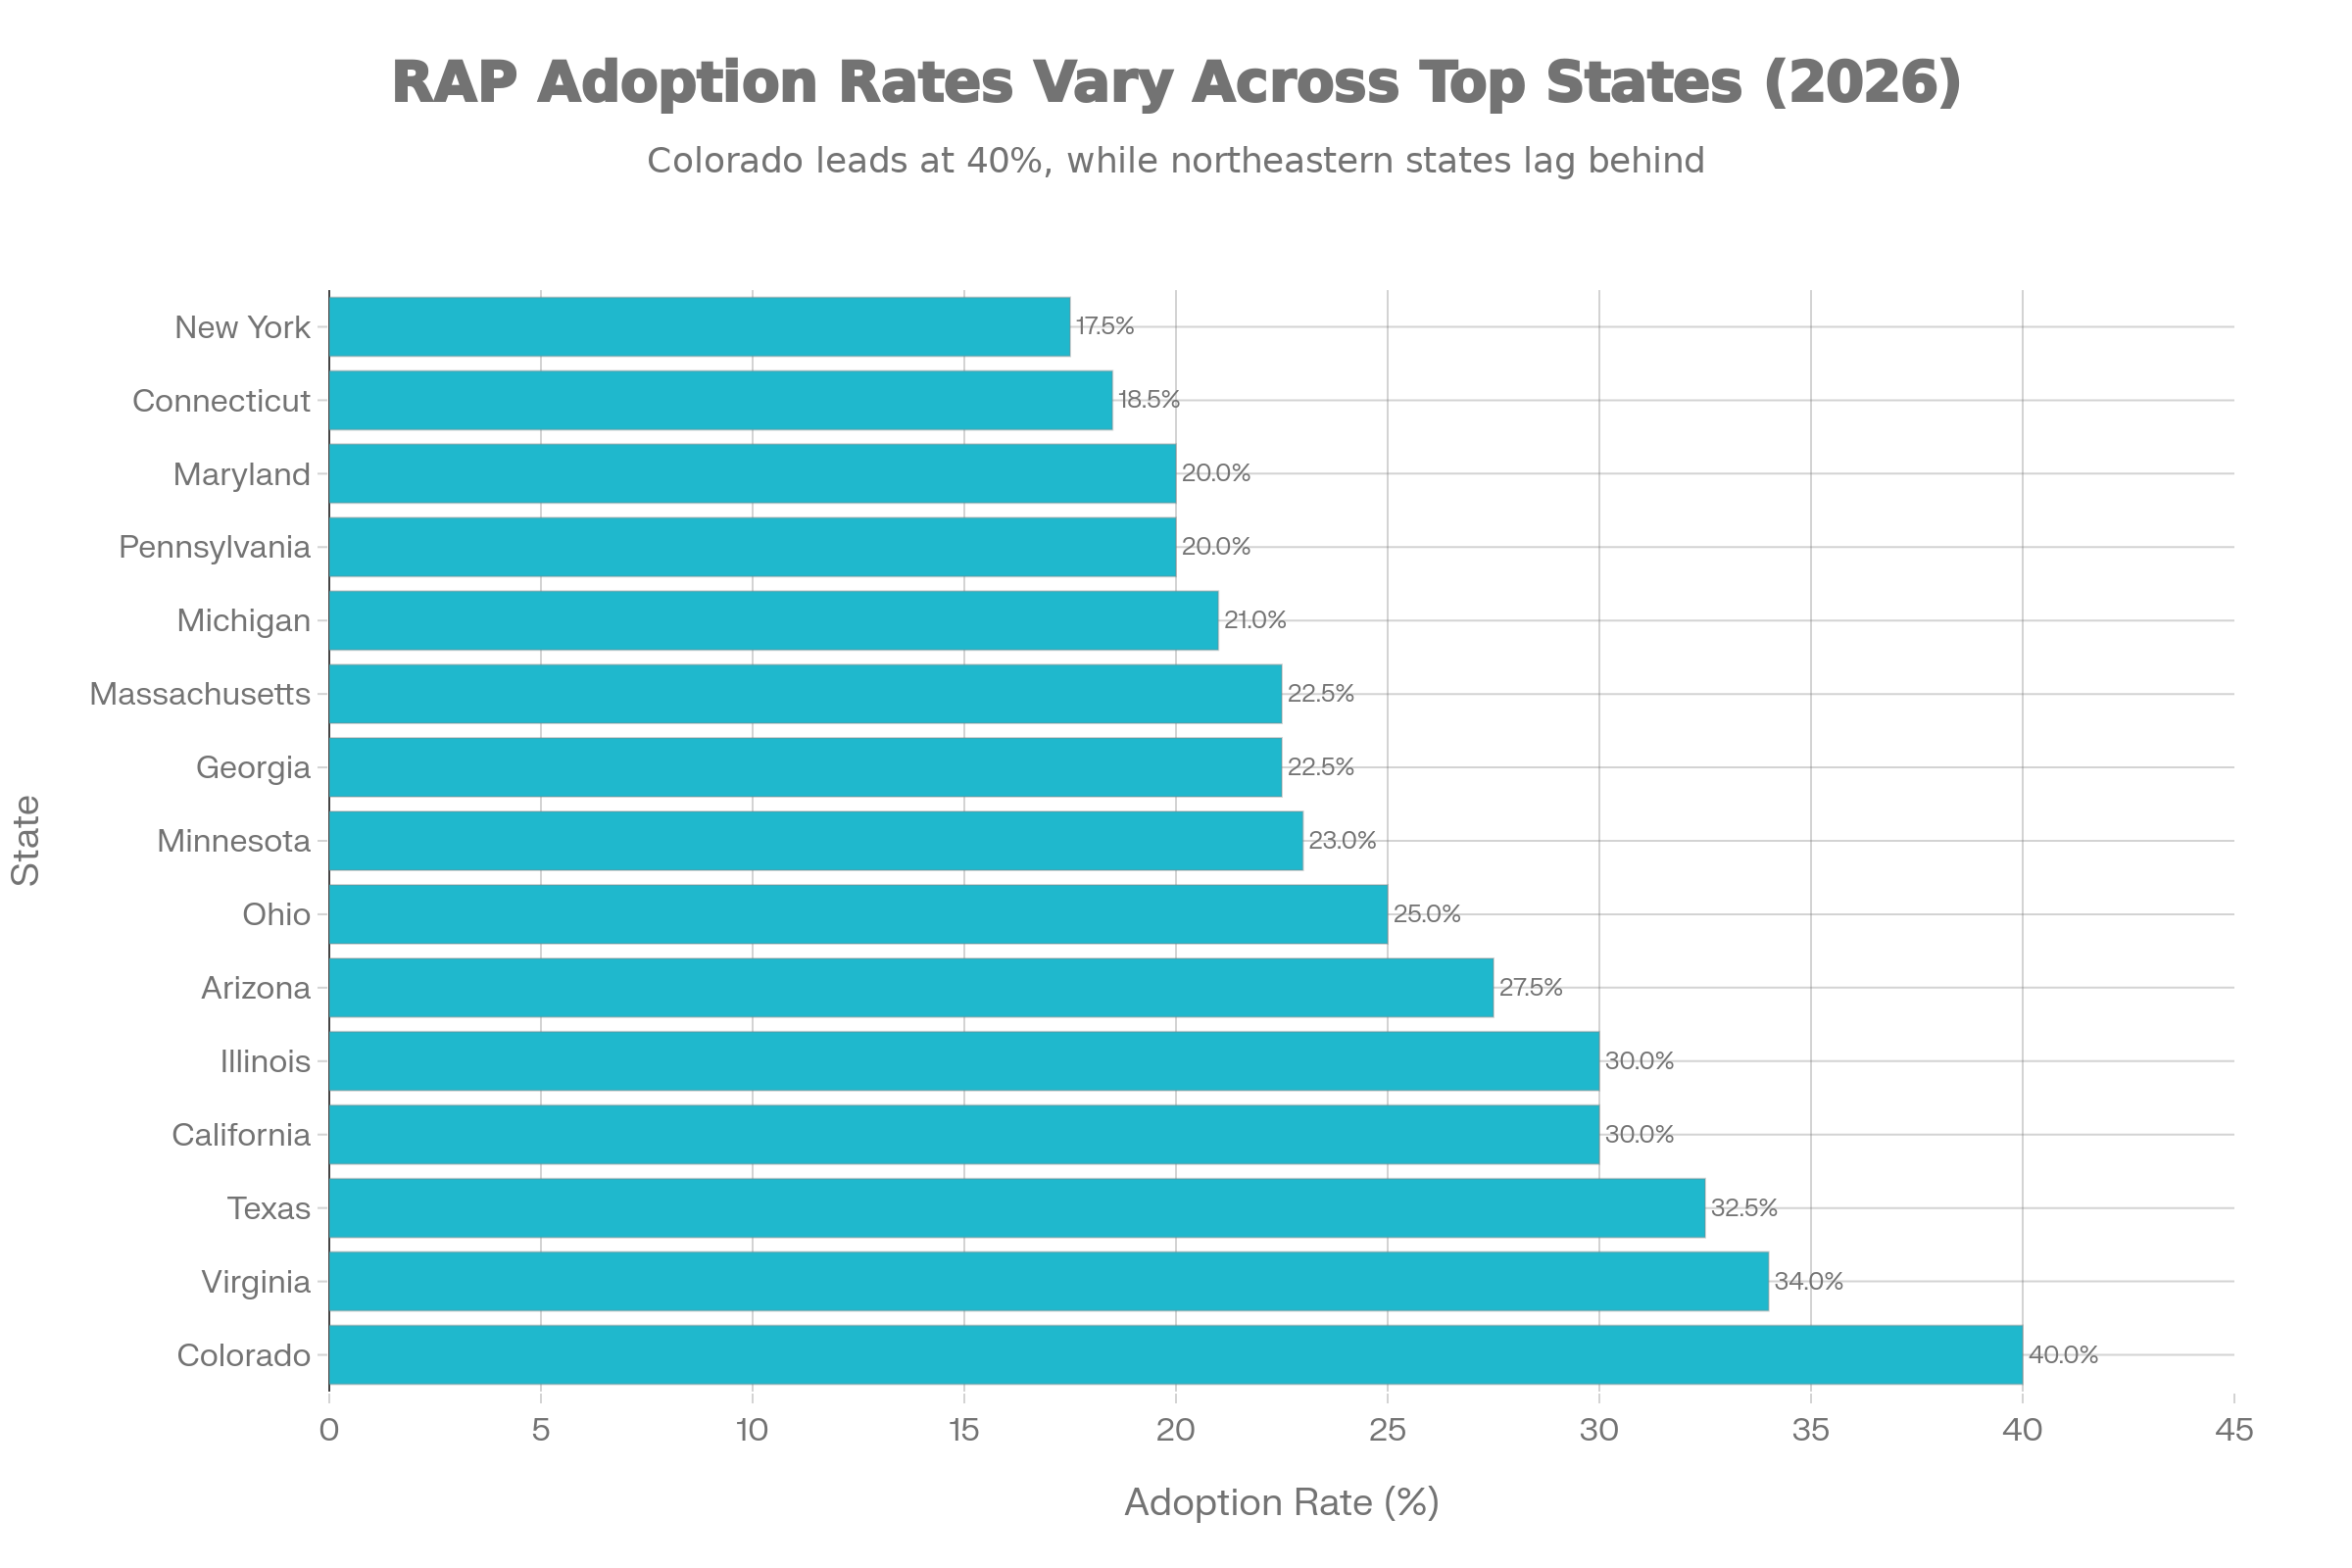
| State | RAP % | Notes |
|---|---|---|
| Colorado | 40% | Aggressive mandate (leading) |
| Texas | 32.5% | Economic advantage |
| Virginia | 34% | DOT leadership |
| California | 30% | Environmental pressure |
| Illinois | 30% | Midwest leader |
8.2 High-RAP Mix Performance
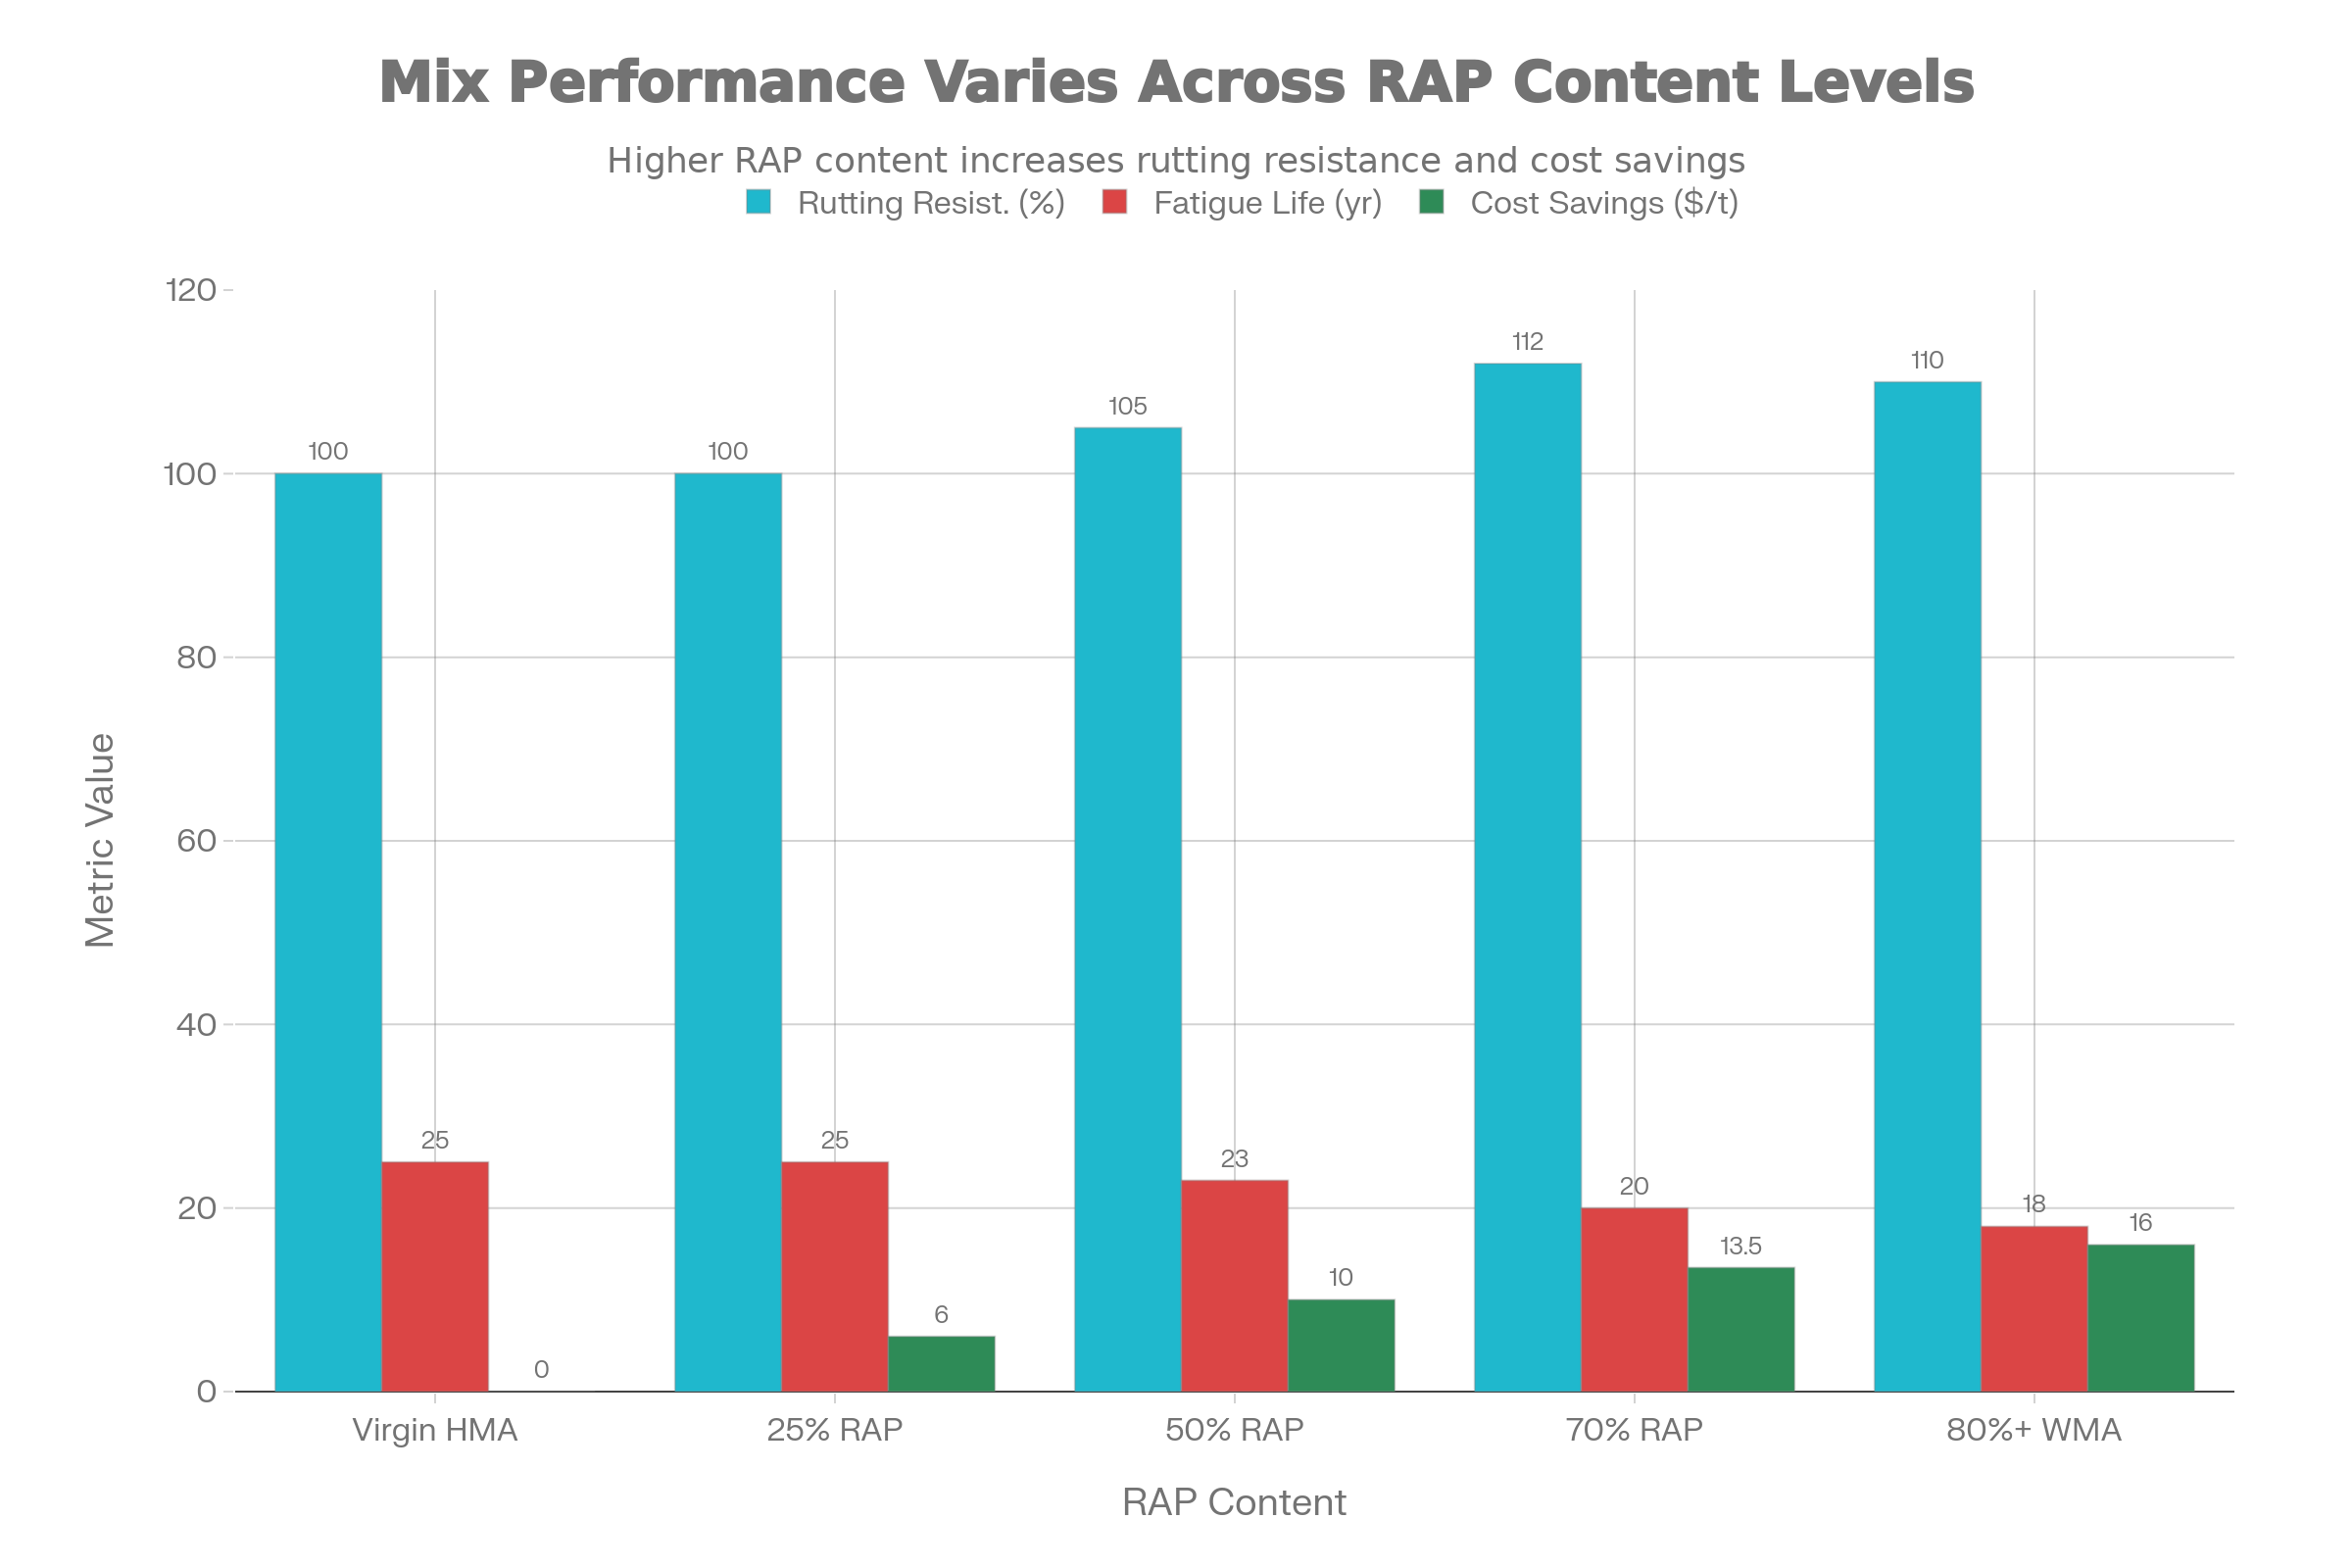
Performance Analysis by RAP Content:
| RAP Content | Rutting Resistance | Fatigue Life | Cost Savings | Best Use |
|---|---|---|---|---|
| Virgin HMA | 100% | 25 years | $0 | All applications |
| 25% RAP | 100% | 25 years | $6/ton | Standard design |
| 50% RAP | +5% | -8% | $10/ton | Binder course |
| 70% RAP | +12% | -15% | $13.50/ton | Base layer |
| 80%+ RAP+WMA | +10% | -18% | $16/ton | Recycling applications |
9. Construction Quality Management (2026 Protocols)
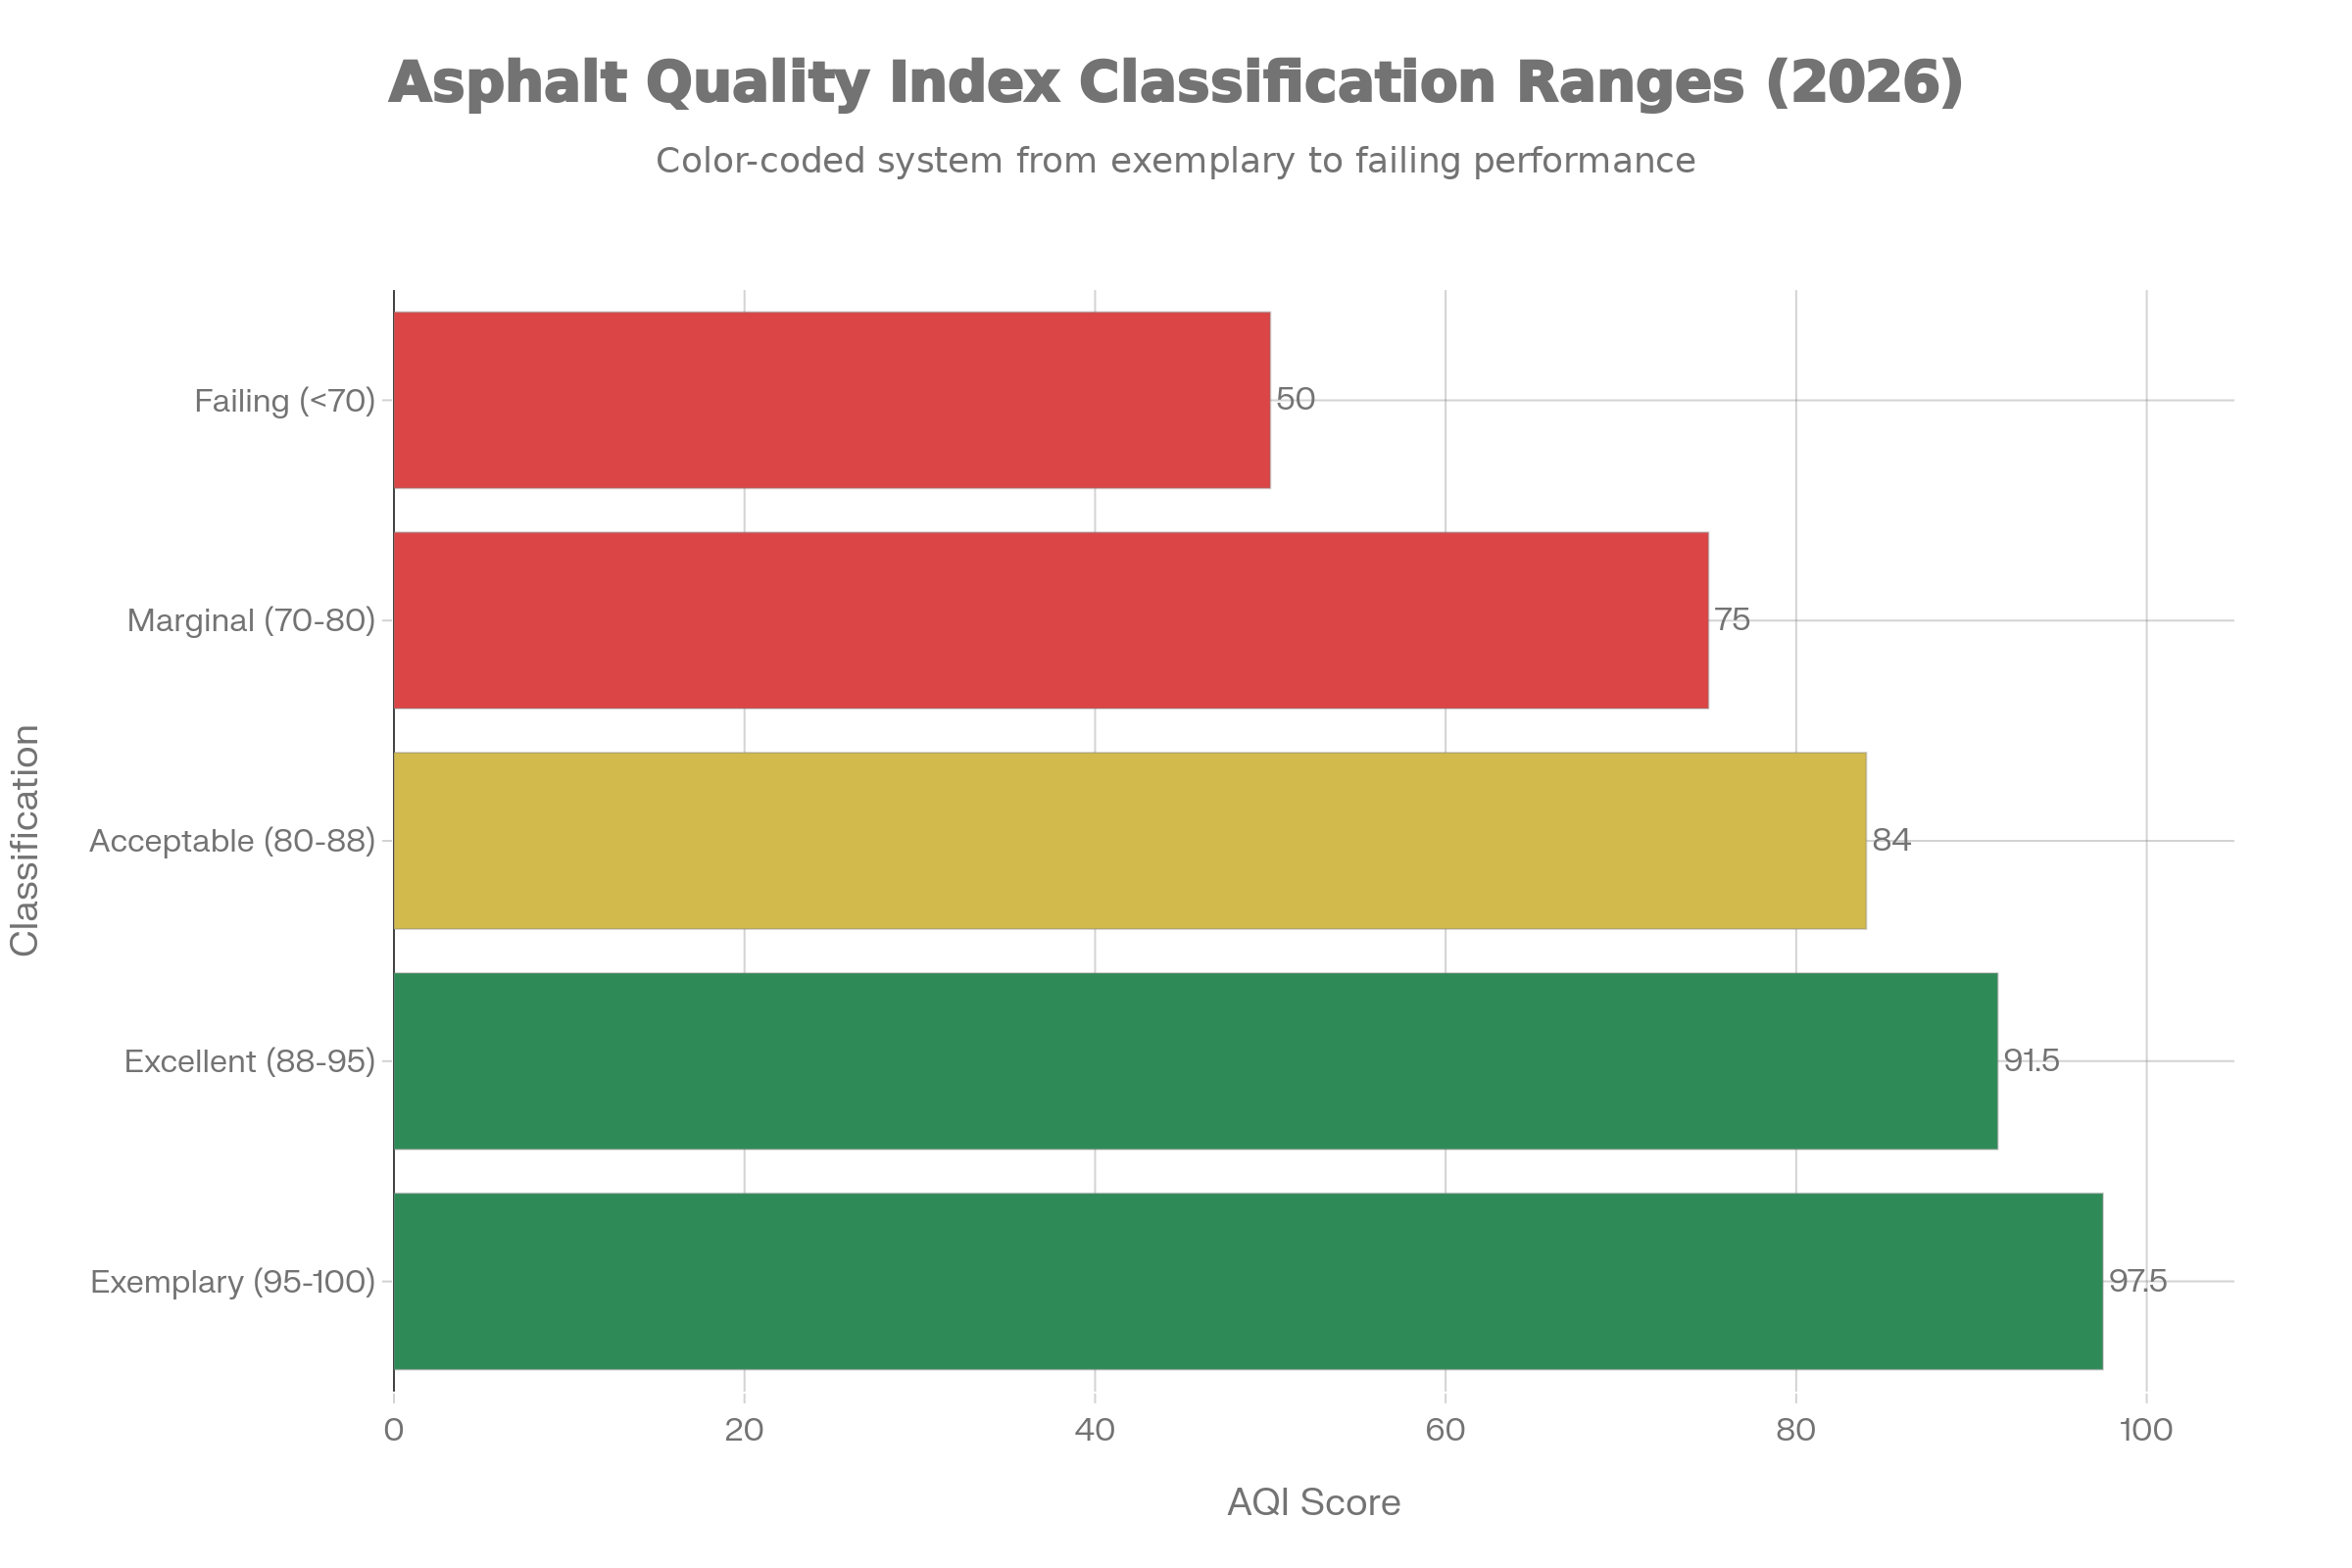
9.1 Asphalt Quality Index (AQI) 2026 Updates
Updated Formula (2026):
AQI = 100 - [0.25×Thickness + 0.40×Density +
             0.18×Asphalt + 0.12×Voids + 0.05×Smoothness]

Changes from 2025:
├─ Density weight increased: 35% → 40% (critical)
├─ New Smoothness factor: 5% weight (IRI measurement)
├─ Thickness weight decreased: 30% → 25%
└─ Rationale: Compaction quality now primary concern

Acceptance Thresholds (2026):
├─ 95-100: Exemplary (bonus up to 3%)
├─ 88-95: Excellent (no deduction)
├─ 80-88: Acceptable (potential -1 to -2%)
├─ 70-80: Marginal (deduction -2 to -5%)
└─ <70: Failing (removal/replacement required)
10. 2026 Regional Case Studies
10.1 I-25 Denver Corridor - Year 2 Performance Review
Original Project (2024): 12-mile section, 200,000+ vehicles/day
2026 Performance Data (24 Months Post-Construction):
Performance Metrics:
├─ Rutting: <0.05" (excellent, better than expected)
├─ Cracking: 0 linear feet (perfect record)
├─ IRI (smoothness): 62 in/mi (excellent condition)
├─ Skid resistance: 65+ (maintained, exceeds spec)
└─ Traffic satisfaction: 97% positive

Material Analysis:
├─ WMA technology: 100% success (no issues)
├─ 40% RAP content: Performing equal to virgin
├─ Rejuvenator: Effective, confirmed via extraction
└─ PG 70-28 upgrade: Justified by summer temps

2026 Recommendation:
└─ Replicate design for similar projects (I-70, I-76)
10.2 Texas Highway 130 - High-RAP Pilot (2026 Results)
Year 2 Assessment:
Design Specifications:
├─ RAP Content: 70% (highest Texas DOT approved)
├─ WMA Technology: Organic additive (Evotherm)
├─ Traffic: 35,000 AADT, 12% trucks
└─ Status: Continued monitoring

Year 2 Results:
├─ Durability: Performing adequately
├─ Safety: No issues reported
├─ Cost savings: $750,000 on 2-mile project
└─ Next step: Expand to 10-mile section in 2027
11. Lifecycle Economics & ROI Analysis (2026)
11.1 Total Cost of Ownership Model
Updated 20-Year Comprehensive Cost Model:
YEAR 0 (Construction - 2026 Dollars)
────────────────────────────────────
Design & engineering:        $50,000
Materials (HMA + tack):       $510,000
Construction labor:           $430,000
Equipment & overhead:         $330,000
─────────────────────
Subtotal Year 0:            $1,320,000

YEARS 1-3 (Routine Maintenance)
───────────────────────────────
Annual sweeping/cleaning:      $6,000/year
Crack sealing:                $2,500/year
Patching (minor):             $1,500/year
─────────────────────
Subtotal 3 years:            $30,000

YEARS 4-20 (Extended Operations)
────────────────────────────────
Various maintenance phases:   $972,000
─────────────────────
TOTAL 20-YEAR COST:         $2,322,000
Annual Average Cost:          $116,100
11.2 Scenario Comparison
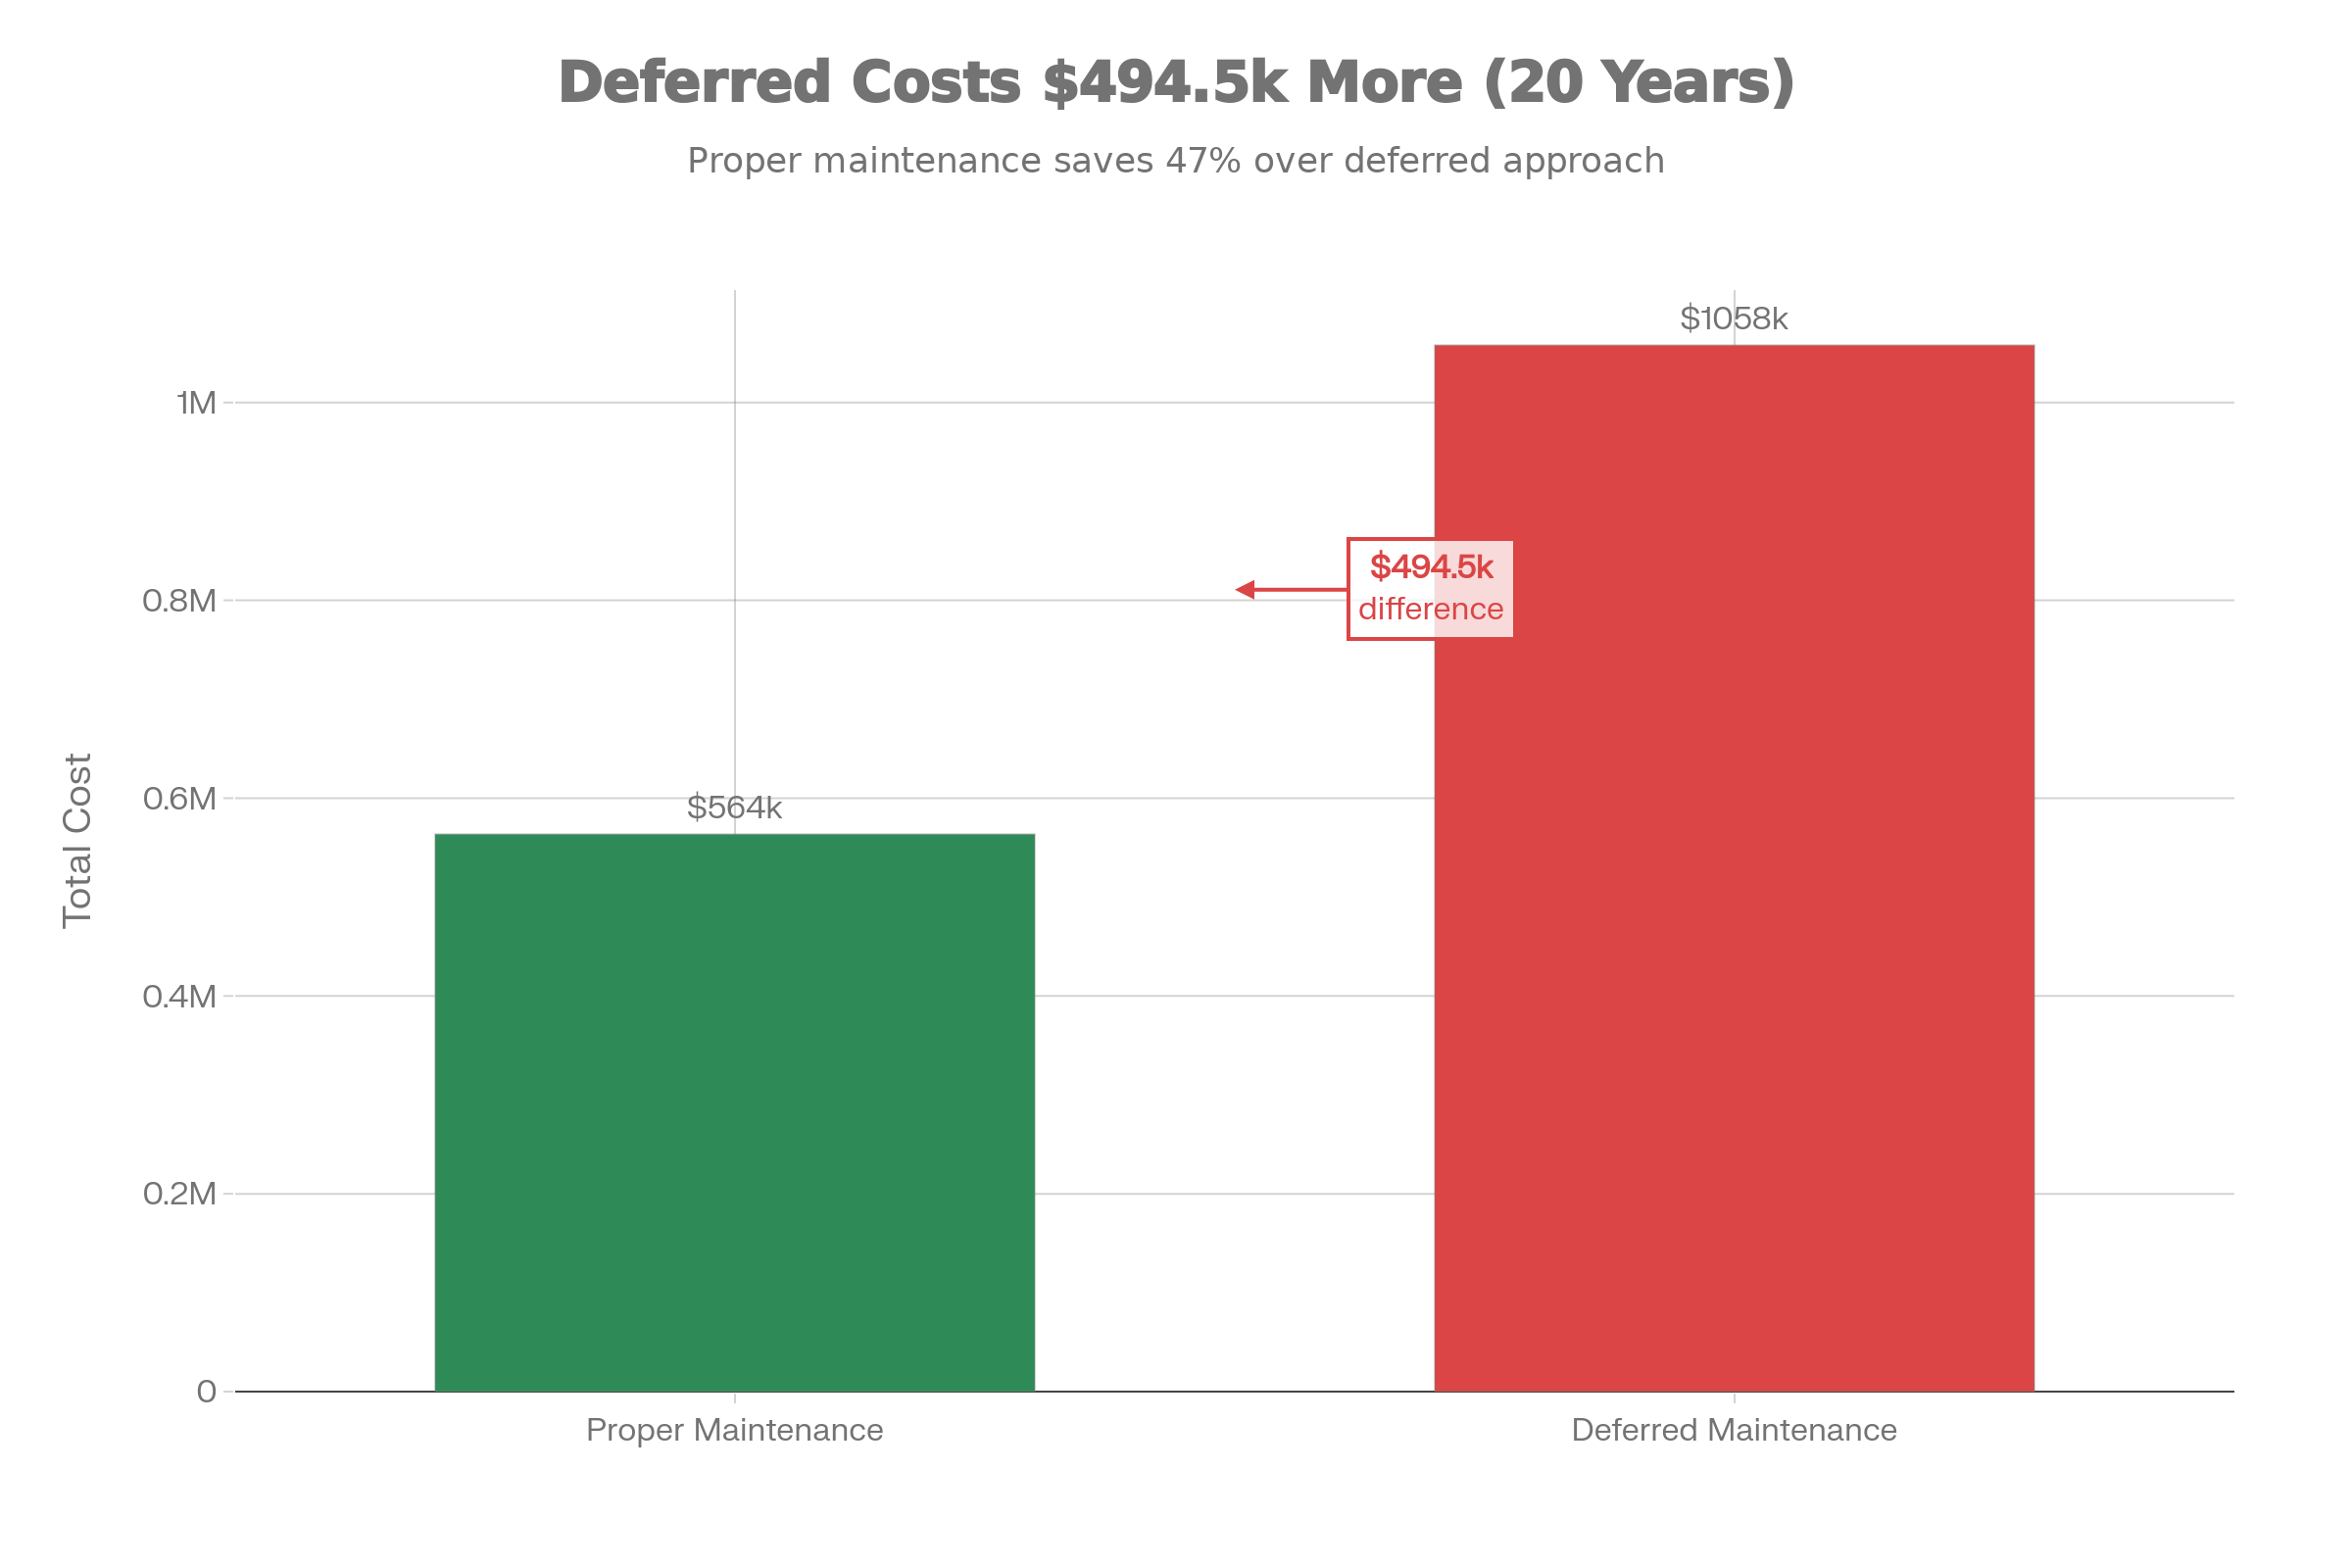
Scenario A: Proper Maintenance (2026)
50,000 sq ft Commercial Parking Lot

Year 0 Construction:         $300,000
Years 1-3: Maintenance:       $6,000
Years 4-6: Seal coat (Yr 4): $28,000
Years 7-9: Microsurface:     $22,500
Year 10: Mill + overlay:     $165,000
Years 11-20: Maintenance:    $42,000
─────────────────────
TOTAL 20-YEAR:              $563,500
Cost per Sq Ft:             $11.27
Annual Average:             $28,175
Scenario B: Deferred Maintenance (2026)
50,000 sq ft Commercial Parking Lot (Poor Management)

Year 0: Low-cost construction:  $210,000
Years 1-5: Minimal maintenance: $3,000
Years 6-7: Emergency repairs:   $45,000
Years 8-9: Major repairs:       $110,000
Year 9: Forced overlay:         $250,000
Years 10-12: Repair cycle:      $150,000
Years 13-15: Overlay:           $210,000
Years 16-20: Continued issues:  $80,000
─────────────────────
TOTAL 20-YEAR:                $1,058,000
Cost per Sq Ft:               $21.16
Annual Average:               $52,900
2026 Cost Differential:
Scenario A (Proper):   $563,500
Scenario B (Deferred): $1,058,000
─────────────────────
Difference:            $494,500 (88% MORE EXPENSIVE!)

Updated ROI:
For every $1 invested in prevention → $3.50-4.00 savings
12. Industry Market Trends
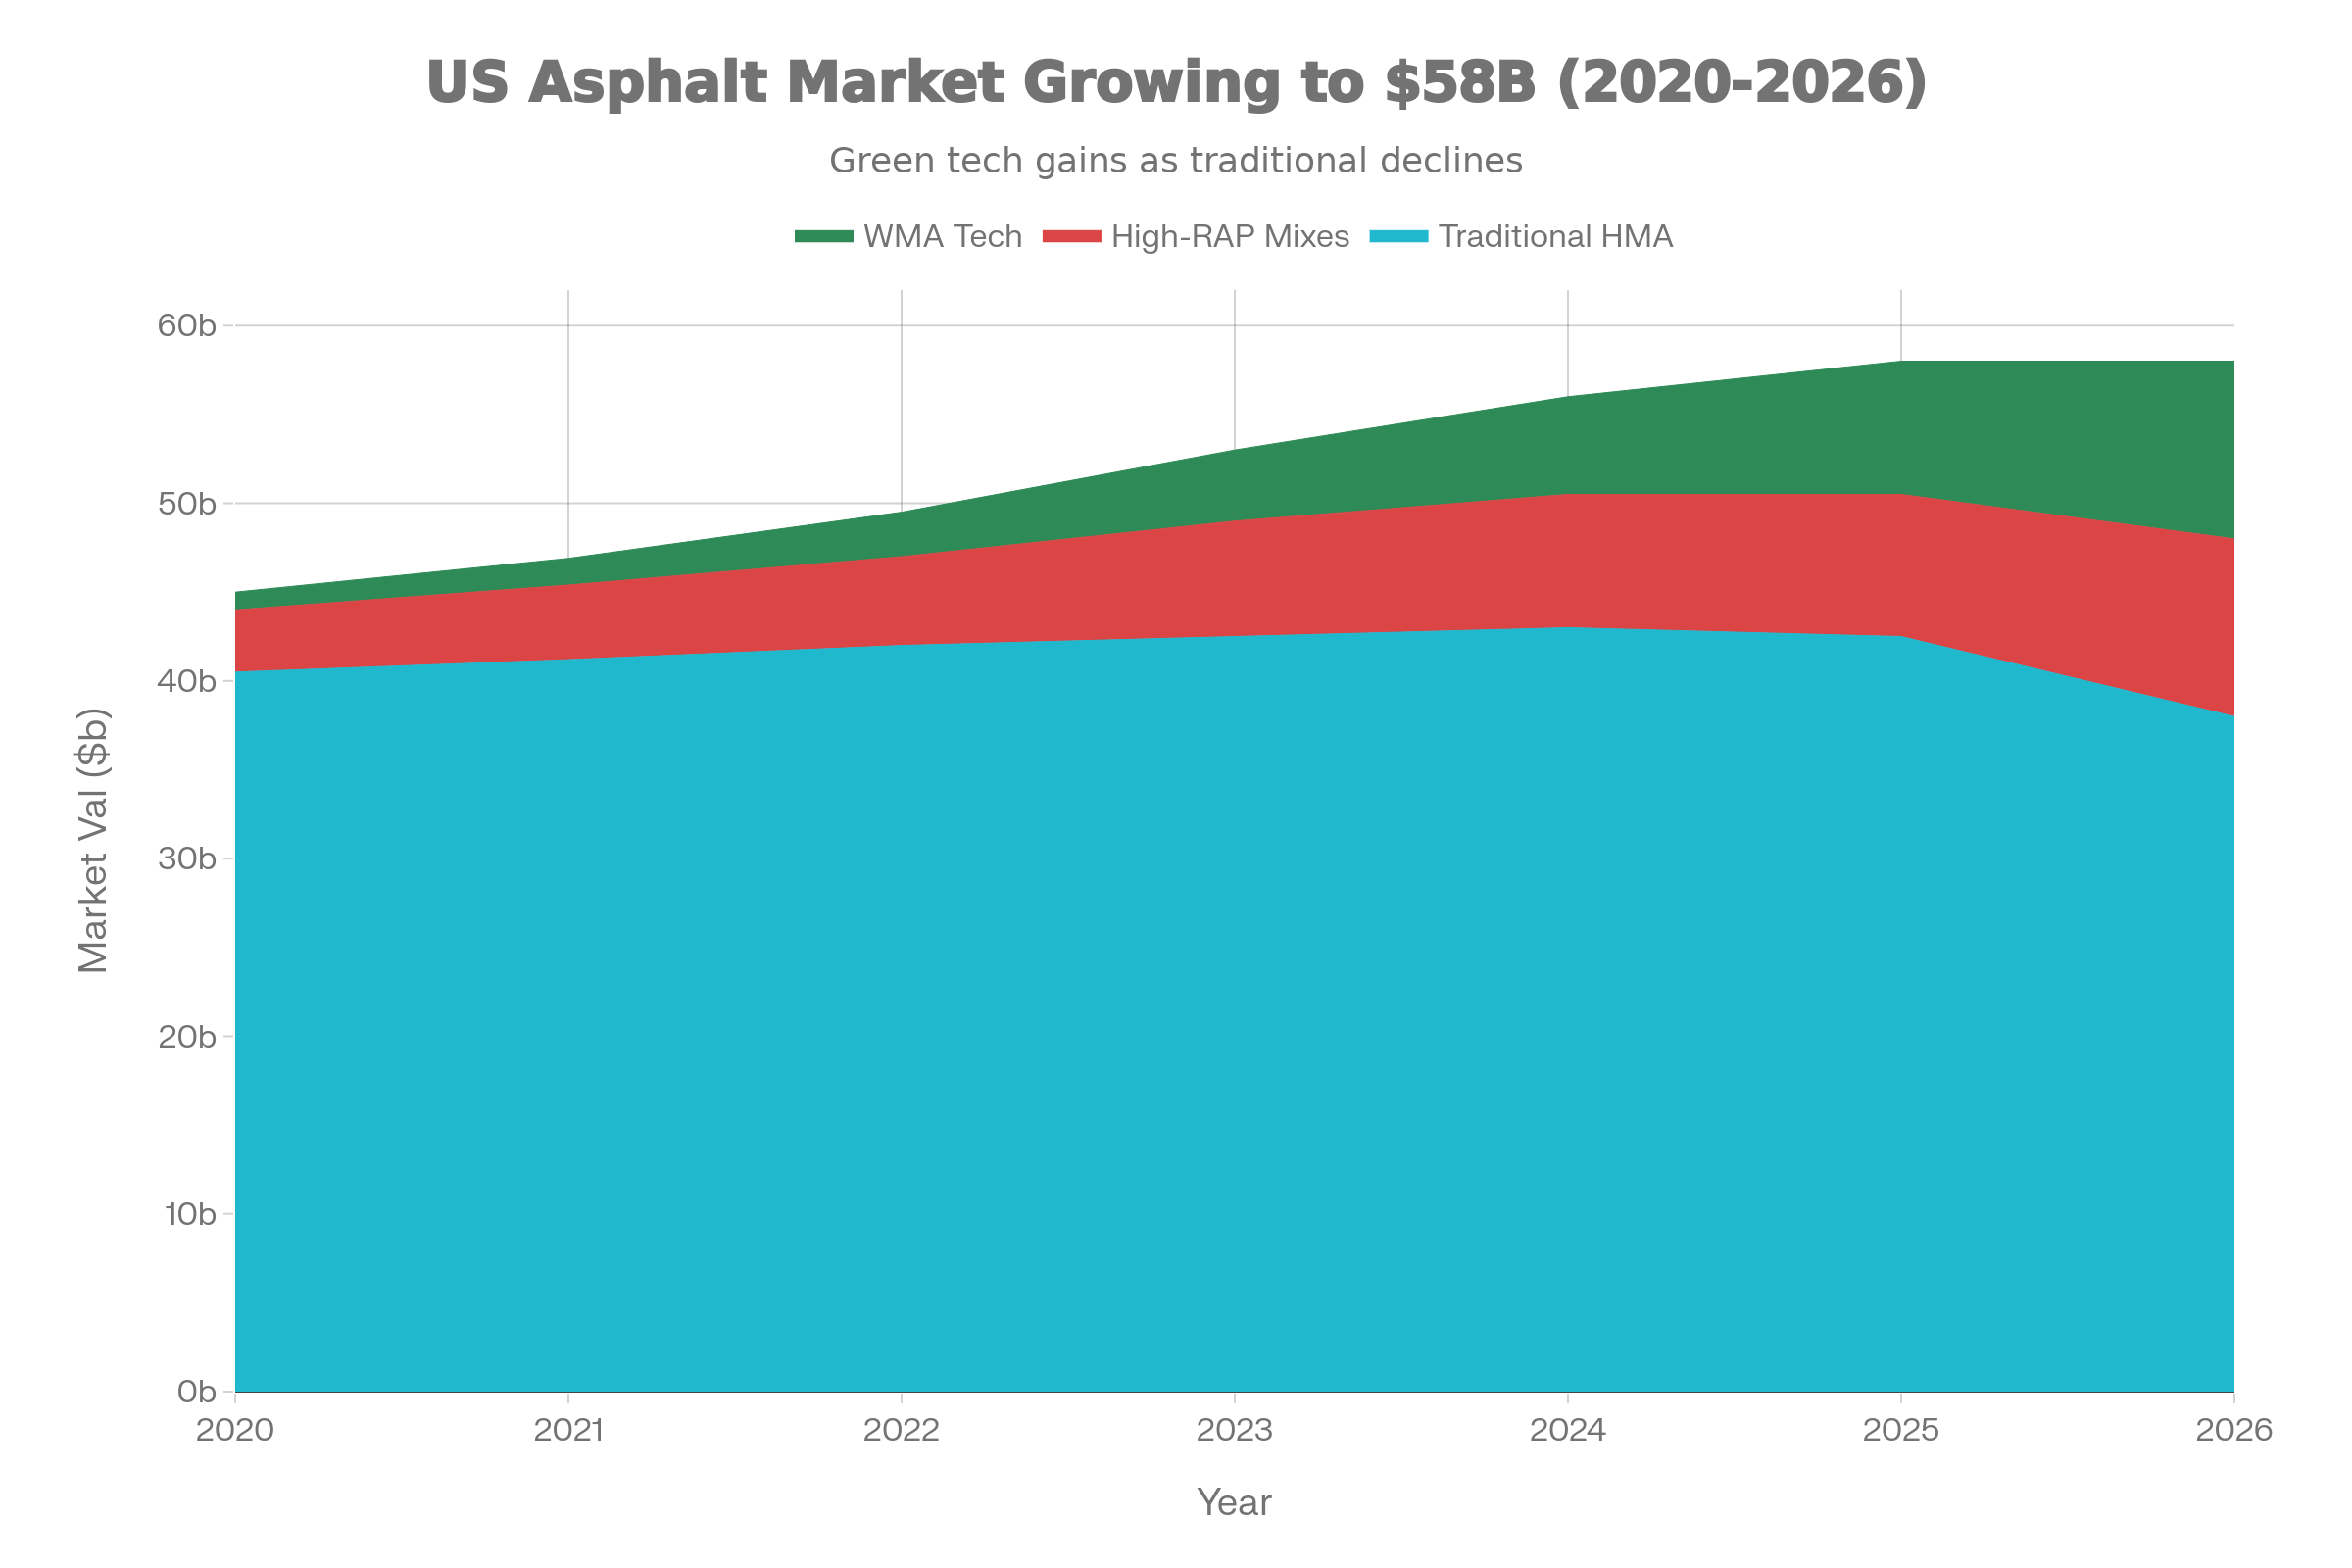
The market has evolved significantly, with traditional HMA declining relatively while high-RAP and WMA technologies grow rapidly, reflecting industry sustainability shift from $45B in 2020 to $58B+ in 2026.
Design Decision Framework
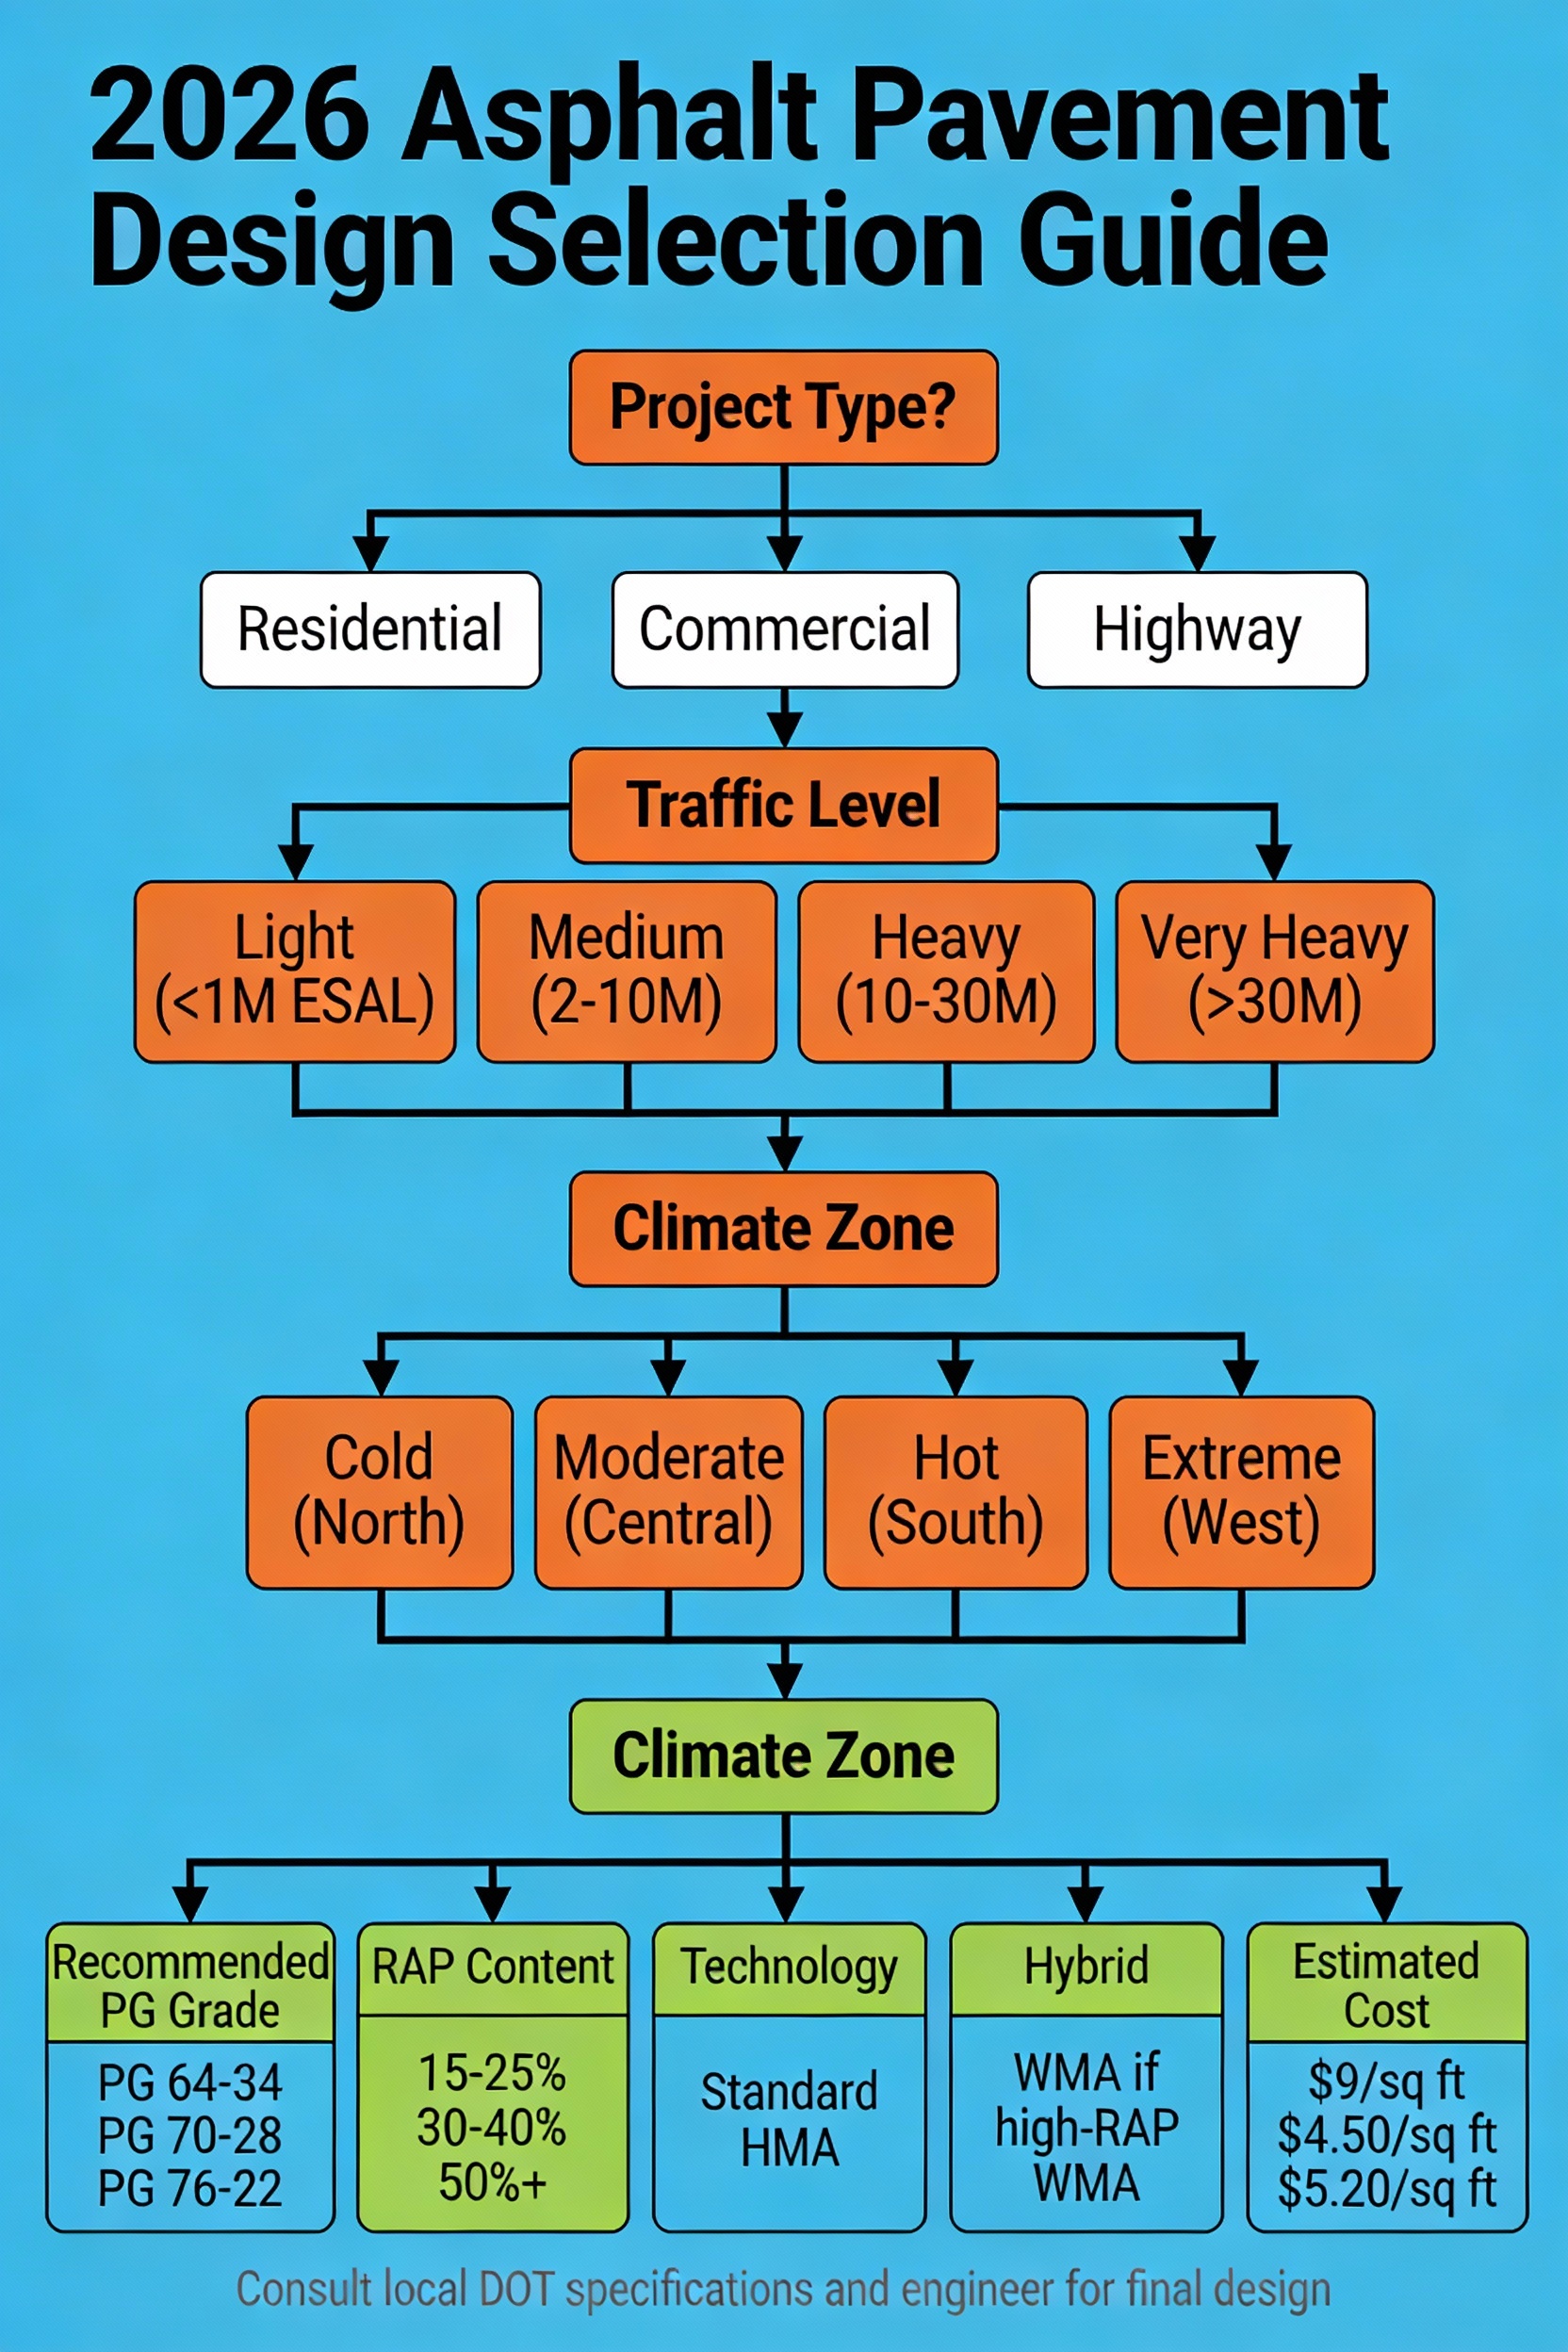
This decision tree guides professionals through key selection criteria:
- Project Type (Residential, Commercial, Highway)
- Traffic Level
- Climate Zone
- Recommended specifications (PG grade, RAP content, technology)
- Cost estimates
Final Recommendations for 2026
For Engineers & Project Managers
- Account for 2026 pricing reality: Plan for $125-165/ton HMA
- Use updated PG grades: Align with 2026-2050 climate projections
- Embrace RAP integration: Target 30-40% for standard projects
- Consider WMA: 32-35% adoption suggests economic viability
- Quality is critical: Enhanced standards require tighter control
For Contractors
- Invest in technology: Nuclear gauge, digital tracking systems
- Plan labor costs: Budget for 12-15% wage inflation
- Secure equipment early: 4-6 week booking window
- Monitor material costs: Oil-linked pricing will fluctuate
- Document everything: AQI scoring increasingly rigorous
For Asset Owners
- Implement preventive maintenance: 3.5-4x ROI in 2026
- Plan 20-year budgets: Avoid emergency repair costs
- Consider RAP/WMA: Environmental & economic benefits
- Monitor climate impacts: Adjust schedules for local conditions
- Use lifecycle costing: Long-term planning essential
Appendix: Quick Reference Tables
2026 PG Binder Selection Quick Reference
| Climate | Recommended Grade | High-Traffic Upgrade | Application |
|---|---|---|---|
| Cold (North) | PG 58-40 | PG 64-40 | Interstate, heavy |
| Moderate (Central) | PG 70-28 | PG 70-34 | Major highways |
| Warm (South) | PG 76-22 | PG 82-22 | High-volume routes |
| Hot (Southwest) | PG 82-12 | PG 88-10 | Desert/extreme |
Installation Cost Summary (2026)
| Project Type | Per Sq Ft | Per Ton | Example Area |
|---|---|---|---|
| Residential | $9-12 | $140/ton | 400 sq ft = $3,667 |
| Commercial | $4-6 | $128/ton | 43,500 sq ft = $186,580 |
| Highway | $4-6 | $132/ton | 1.2M sq ft = $5,627,086 |